- Download http://www.microsoft.com/downloads/details.aspx?familyid=9a8b005b-84e4-4f24-8d65-cb53442d9e19&displaylang=en and install SQLIO
- It will be installed under C:\Program Files\SQLIO. Please add this directory in your FIle Path
- SQLIO will need a test file to run against your drives for performance.
First look at C:\SQLIO\param.txt which would look like something below.
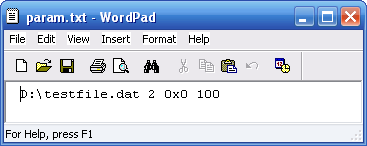
- First parameter (D:\testfile.dat)- the physical location of the testing file. Change the drive letter to point to the SAN drive you want to test, like D:\testfile.dat here.
- Last parameter (10)- the size of the testing file in megabytes. Increase this to 20480 or larger.
Now run following command to create D:\testfile.dat. test file. “sqlio -kW -s10 -fsequential -o8 -b8 -LS -Fparam.txt timeout /T 10”
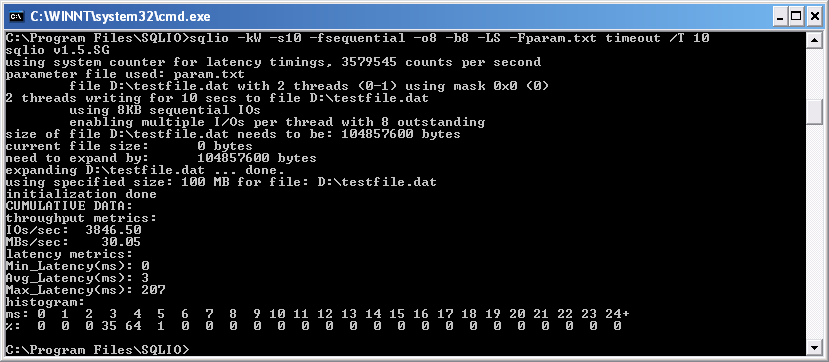
Please see there is a file created at “D:\testfile.dat”, here 100MB as I defined it in the param.txt

Testing Your SAN Performance:
Let’s create a batch file SAN_RESULTS.TXT to take all of the possibilities and run them all.
— Random Reads
sqlio -kW -t3 -s90 -dD -o1 -frandoD -b64 -BH -LS Testfile.dat
sqlio -kW -t3 -s90 -dD -o2 -frandoD -b64 -BH -LS Testfile.dat
sqlio -kW -t3 -s90 -dD -o4 -frandoD -b64 -BH -LS Testfile.dat
sqlio -kW -t3 -s90 -dD -o8 -frandoD -b64 -BH -LS Testfile.dat
sqlio -kW -t3 -s90 -dD -o16 -frandoD -b64 -BH -LS Testfile.dat
sqlio -kW -t3 -s90 -dD -o32 -frandoD -b64 -BH -LS Testfile.dat
sqlio -kW -t3 -s90 -dD -o64 -frandoD -b64 -BH -LS Testfile.dat
sqlio -kW -t3 -s90 -dD -o128 -frandoD -b64 -BH -LS Testfile.dat
— Sequential Reads
sqlio -kW -t3 -s90 -dD -o1 -fsequential -b64 -BH -LS Testfile.dat
sqlio -kW -t3 -s90 -dD -o2 -fsequential -b64 -BH -LS Testfile.dat
sqlio -kW -t3 -s90 -dD -o4 -fsequential -b64 -BH -LS Testfile.dat
sqlio -kW -t3 -s90 -dD -o8 -fsequential -b64 -BH -LS Testfile.dat
sqlio -kW -t3 -s90 -dD -o16 -fsequential -b64 -BH -LS Testfile.dat
sqlio -kW -t3 -s90 -dD -o32 -fsequential -b64 -BH -LS Testfile.dat
sqlio -kW -t3 -s90 -dD -o64 -fsequential -b64 -BH -LS Testfile.dat
sqlio -kW -t3 -s90 -dD -o128 -fsequential -b64 -BH -LS Testfile.dat
- -kW means writes (as opposed to reads)
- -t23means two threads
- -s120 means test for 120 seconds
- -dD means drive letter D (Please edit and add your SAN drive there)
- -o1 means one outstanding request (not piling up requests)
- -frandom means random access (as opposed to sequential)
- -b64 means 64kb IOs
Commonly used SQLIO.exe options
|
Option
|
Description
|
|
-o
|
Specify the number of outstanding I/O requests. Increasing the queue depth may result in a higher total throughput. However, increasing this number too high may result in problems (described in more detail below). Common values for this are 8, 32, and 64.
|
|
-LS
|
Capture disk latency information. Capturing latency data is recommended when testing a system.
|
|
-k
|
Specify either R or W (read or write).
|
|
-s
|
Duration of test (seconds). For initial tests, running for 5-10 minutes per I/O size is recommended to get a good idea of I/O performance.
|
|
-b
|
Size of the IO request in bytes.
|
|
-f
|
Type of IO to issue. Either ‘random’ or ‘sequential’.
|
|
-F
|
Name of the file which will contain the test files to run SQLIO against.
|
Then go to the command prompt in the same directory as SQLIO is installed and type: “SANTESTER.BAT > SAN_RESULTS.TXT ” , You will see a output like below.
For in depth details see Using SQLIO.rtf
C:\Program Files\SQLIO>REM — Sequential Reads
C:\Program Files\SQLIO>sqlio -kW -t1 -s90 -dD -o1 -fsequential -b64 -BH -LS Testfile.dat
sqlio v1.5.SG
using system counter for latency timings, 3579545 counts per second
1 thread writing for 90 secs to file D:Testfile.dat
using 64KB sequential IOs
enabling multiple I/Os per thread with 1 outstanding
buffering set to use hardware disk cache (but not file cache)
using current size: 100 MB for file: D:Testfile.dat
initialization done
CUMULATIVE DATA:
throughput metrics:
IOs/sec: 353.01
MBs/sec: 22.06
latency metrics:
Min_Latency(ms): 0
Avg_Latency(ms): 2
Max_Latency(ms): 748
histogram:
ms: 0 1 2 3 4 5 6 7 8 9 10 11 12 13 14 15 16 17 18 19 20 21 22 23 24+
%: 52 36 8 0 0 0 0 0 0 0 0 0 0 0 0 0 0 0 0 0 0 0 0 0 2
C:\Program Files\SQLIO>sqlio -kW -t1 -s90 -dD -o2 -fsequential -b64 -BH -LS Testfile.dat
sqlio v1.5.SG
using system counter for latency timings, 3579545 counts per second
1 thread writing for 90 secs to file D:Testfile.dat
using 64KB sequential IOs
enabling multiple I/Os per thread with 2 outstanding
buffering set to use hardware disk cache (but not file cache)
using current size: 100 MB for file: D:Testfile.dat
initialization done
CUMULATIVE DATA:
throughput metrics:
IOs/sec: 473.17
MBs/sec: 29.57
latency metrics:
Min_Latency(ms): 0
Avg_Latency(ms): 3
Max_Latency(ms): 331
histogram:
ms: 0 1 2 3 4 5 6 7 8 9 10 11 12 13 14 15 16 17 18 19 20 21 22 23 24+
%: 8 18 4 42 26 0 0 0 0 0 0 0 0 0 0 0 0 0 0 0 0 0 0 0 1
C:\Program Files\SQLIO>sqlio -kW -t1 -s90 -dD -o4 -fsequential -b64 -BH -LS Testfile.dat
sqlio v1.5.SG
using system counter for latency timings, 3579545 counts per second
1 thread writing for 90 secs to file D:Testfile.dat
using 64KB sequential IOs
enabling multiple I/Os per thread with 4 outstanding
buffering set to use hardware disk cache (but not file cache)
using current size: 100 MB for file: D:Testfile.dat
initialization done
CUMULATIVE DATA:
throughput metrics:
IOs/sec: 515.11
MBs/sec: 32.19
latency metrics:
Min_Latency(ms): 0
Avg_Latency(ms): 7
Max_Latency(ms): 350
histogram:
ms: 0 1 2 3 4 5 6 7 8 9 10 11 12 13 14 15 16 17 18 19 20 21 22 23 24+
%: 0 2 6 0 0 0 21 68 1 0 0 0 0 0 0 0 0 0 0 0 0 0 0 0 1
C:\Program Files\SQLIO>sqlio -kW -t1 -s90 -dD -o8 -fsequential -b64 -BH -LS Testfile.dat
sqlio v1.5.SG
using system counter for latency timings, 3579545 counts per second
1 thread writing for 90 secs to file D:Testfile.dat
using 64KB sequential IOs
enabling multiple I/Os per thread with 8 outstanding
buffering set to use hardware disk cache (but not file cache)
using current size: 100 MB for file: D:Testfile.dat
initialization done
CUMULATIVE DATA:
throughput metrics:
IOs/sec: 516.03
MBs/sec: 32.25
latency metrics:
Min_Latency(ms): 0
Avg_Latency(ms): 14
Max_Latency(ms): 360
histogram:
ms: 0 1 2 3 4 5 6 7 8 9 10 11 12 13 14 15 16 17 18 19 20 21 22 23 24+
%: 0 0 0 2 3 3 0 0 0 0 0 0 0 32 44 14 0 0 0 0 0 0 0 0 1
C:\Program Files\SQLIO>sqlio -kW -t1 -s90 -dD -o16 -fsequential -b64 -BH -LS Testfile.dat
sqlio v1.5.SG
using system counter for latency timings, 3579545 counts per second
1 thread writing for 90 secs to file D:Testfile.dat
using 64KB sequential IOs
enabling multiple I/Os per thread with 16 outstanding
buffering set to use hardware disk cache (but not file cache)
using current size: 100 MB for file: D:Testfile.dat
initialization done
CUMULATIVE DATA:
throughput metrics:
IOs/sec: 519.12
MBs/sec: 32.44
latency metrics:
Min_Latency(ms): 1
Avg_Latency(ms): 30
Max_Latency(ms): 364
histogram:
ms: 0 1 2 3 4 5 6 7 8 9 10 11 12 13 14 15 16 17 18 19 20 21 22 23 24+
%: 0 0 0 0 0 0 0 0 1 1 3 1 0 0 0 0 0 0 0 0 0 0 0 0 92
C:\Program Files\SQLIO>sqlio -kW -t1 -s90 -dD -o32 -fsequential -b64 -BH -LS Testfile.dat
sqlio v1.5.SG
using system counter for latency timings, 3579545 counts per second
1 thread writing for 90 secs to file D:Testfile.dat
using 64KB sequential IOs
enabling multiple I/Os per thread with 32 outstanding
buffering set to use hardware disk cache (but not file cache)
using current size: 100 MB for file: D:Testfile.dat
initialization done
CUMULATIVE DATA:
throughput metrics:
IOs/sec: 524.43
MBs/sec: 32.77
latency metrics:
Min_Latency(ms): 13
Avg_Latency(ms): 60
Max_Latency(ms): 414
histogram:
ms: 0 1 2 3 4 5 6 7 8 9 10 11 12 13 14 15 16 17 18 19 20 21 22 23 24+
%: 0 0 0 0 0 0 0 0 0 0 0 0 0 0 0 0 1 0 0 1 1 1 0 0 94
C:\Program Files\SQLIO>sqlio -kW -t1 -s90 -dD -o64 -fsequential -b64 -BH -LS Testfile.dat
sqlio v1.5.SG
using system counter for latency timings, 3579545 counts per second
1 thread writing for 90 secs to file D:Testfile.dat
using 64KB sequential IOs
enabling multiple I/Os per thread with 64 outstanding
buffering set to use hardware disk cache (but not file cache)
using current size: 100 MB for file: D:Testfile.dat
initialization done
CUMULATIVE DATA:
throughput metrics:
IOs/sec: 522.62
MBs/sec: 32.66
latency metrics:
Min_Latency(ms): 28
Avg_Latency(ms): 121
Max_Latency(ms): 507
histogram:
ms: 0 1 2 3 4 5 6 7 8 9 10 11 12 13 14 15 16 17 18 19 20 21 22 23 24+
%: 0 0 0 0 0 0 0 0 0 0 0 0 0 0 0 0 0 0 0 0 0 0 0 0 100
C:\Program Files\SQLIO>sqlio -kW -t1 -s90 -dD -o128 -fsequential -b64 -BH -LS Testfile.dat
sqlio v1.5.SG
using system counter for latency timings, 3579545 counts per second
1 thread writing for 90 secs to file D:Testfile.dat
using 64KB sequential IOs
enabling multiple I/Os per thread with 128 outstanding
buffering set to use hardware disk cache (but not file cache)
using current size: 100 MB for file: D:Testfile.dat
initialization done
CUMULATIVE DATA:
throughput metrics:
IOs/sec: 527.72
MBs/sec: 32.98
latency metrics:
Min_Latency(ms): 11
Avg_Latency(ms): 241
Max_Latency(ms): 597
histogram:
ms: 0 1 2 3 4 5 6 7 8 9 10 11 12 13 14 15 16 17 18 19 20 21 22 23 24+
%: 0 0 0 0 0 0 0 0 0 0 0 0 0 0 0 0 0 0 0 0 0 0 0 0 100

 Tweet
Tweet