Monitoring Application Performance using Websphere Request Metrics

Posted by Sagar Patil

Version 6.x of WebSphere introduced Request Metrics (PMRM), which unlike Performance Monitoring Infrastructure (PMI) metrics, are transaction based.

PMRM can be a useful first step in performance analysis of your application. The PMRM records show the elapsed time for each request.
The PMRM records are written to the SystemOut log file for the JVM in which the request is processed. In a Network Deployment configuration, the WebSphere Http Plugin running inside the web server also writes PMRM records to its http-plugin.log file giving a composite view of application performance across all JVM’s.

The log records contains information about the flow of the transaction through the WebSphere JVMs. The last fields are of particular interest during performance monitoring.

The SystemOut file contains

1. Name of servlet

2. Response time

In addition, the web server http-plugin.log file contains

3. Size of the request

4. Size of the response

How to Activate Request Metrics ?

Select “Request Metrics” & you will a see screen below.

We can also set filters on modules to be logged

Let’s say we want to trace JDBC connections & transaction time.

Choose Custom -> JDBC & click “Standard logs” option to log information at SystemOut.log & http-plugin.log.

Once activated you will see details as below at Systemout.log

[16/08/11 15:23:58:529 BST] 000000e0 PmiRmArmWrapp I   PMRM0003I:  parent:ver=1,ip=172.30.9.24,time=1313495871159,pid=11183,reqid=16634,event=1 – current:ver=1,ip=172.30.9.24,time=1313495871159,pid=11183,reqid=16641,event=1 type=JDBC detail=java.sql.PreparedStatement.executeQuery() elapsed=0

[16/08/11 15:25:08:956 BST] 000000df PmiRmArmWrapp I   PMRM0003I:  parent:ver=1,ip=172.30.9.24,time=1313495871159,pid=11183,reqid=469,event=1 – current:ver=1,ip=172.30.9.24,time=1313495871159,pid=11183,reqid=522,event=1 type=JDBC detail=java.sql.PreparedStatement.executeQuery() elapsed=1

You should see similar records in http-plugin.log

Monitor SSL Certificate Expiration/Replace Expired SSL Certificates Automatically

Posted by Sagar Patil

Problem : I have websphere systems which are roll forwarded in future and then rolled back to current date. Certain times I get SSL errors in my log despite setting option to replace expired certificates at deployment manager.

The certificate expiration monitor task runs under the deployment manager process.

The certificate expiration monitor administrative task cycles through all the keystores that are configured in the security.xml file and reports on any certificates that expire within a specified threshold, which is typically within 30 days.

The default self-signed certificate on each node expires 365 days after creation. You can modify the certificate validity period by changing the default value for the com.ibm.ssl.defaultCertReqDays=365 property in the ssl.client.props global property area for clients. You can also specify this property as a security custom property on the administrative console. Click Security > Secure administration, applications, and infrastructure > Custom properties.

The expiration monitor automatically replaces only self-signed certificates that meet the expiration threshold criteria.

<wsSchedules xmi:id=”WSSchedule_2″ name=”ExpirationMonitorSchedule” frequency=”28″ dayOfWeek=”1″ hour=”21″ minute=”30″ nextStartDate=”1312144223207″/>
<wsNotifications xmi:id=”WSNotification_1″ name=”MessageLog” logToSystemOut=”true” emailList=””/>
<wsCertificateExpirationMonitor xmi:id=”WSCertificateExpirationMonitor_1″ name=”Certificate Expiration Monitor” autoReplace=”true” daysBeforeNotification=”60″ isEnabled=”true” wsNotification=”WSNotification_1″ wsSchedule=”WSSchedule_2″/>

To replace all of the signers from the old certificate with the signer that belongs to the new certificate in all the keystores in the configuration for that cell, set the autoReplace attribute to true.

When the deleteOld attribute is true, the old personal certificate and old signers also are deleted from the keystores.

The isEnabled attribute determines whether the expiration monitor task runs based upon the nextStartDate attribute that is derived from the schedule. The nextStartDate attribute is derived from the schedule in milliseconds since 1970, and is identical to the System.currentTimeMillis(). If the nextStartDate has already passed when an expiration monitor process begins, and the expiration monitor is enabled, the task is started, but a new nextStartDate value is established based on the schedule.

<wsNotifications xmi:id=”WSNotification_1″ name=”MessageLog” logToSystemOut=”true” emailList=””/>

For expiration monitor notifications, you can select message log, e-mail using SMTP server, or both methods of notification. When you configure the e-mail option, use the format user@domain@smtpserver.

To specify multiple e-mail addresses using scripting, you must add a pipe (|) character between entries. When you specify the logToSystemOut attribute, the expiration monitor results are sent to the message log for the environment, which is typically the SystemOut.log file.

How to Locate Connection Leak in Websphere

Posted by Sagar Patil

Websphere connection manager generally will timeout orphaned connections and send it back to connection pool for reuse. If threads do timeout waiting for connection, connection manager will raise Connectionwaittimeoutexception at websphere logs.

Common reason for connection leak is , application not using connection.close() call at finally{} code block. When trace is enabled, Websphere connection pool manager will print stack traces detailing how long connection been in use.

It only prints trace information if connection was in use for more than 10 seconds. This interval is unchangeable without IBM support assistance.

Let’s gather connection leak trace …
Navigate to Logging and Tracing > %Application_Server_Name%> Diagnostic Trace Service > Change Log Detail Level

Alter the logging level as *=info: ConnLeakLogic=finest

If you want to see all options availble click on “ConnLeakLogic” which will give you options like screenshot below, select finest.

You may have to restart Application server to see log being created $WAS_HOME/Profiles/node/logs/%Server_Name%/trace.log
Search Trace.log for keyword “Connection Leak Logic Information”. If present you know there are connections being used for more than 10 sec.

In an example above doGet method is using connection for 20 sec i.e 10 sec ping time +11 sec in use time.


Websphere Dmgr- Node Synchronization : WSX509TrustMa E CWPKI0311E

Posted by Sagar Patil

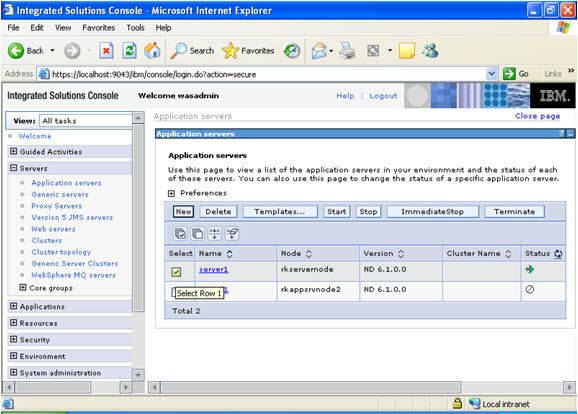
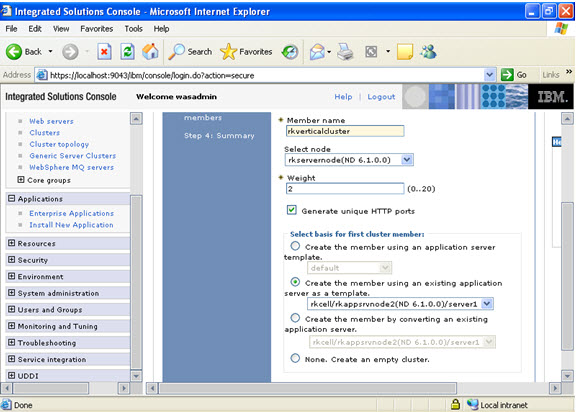
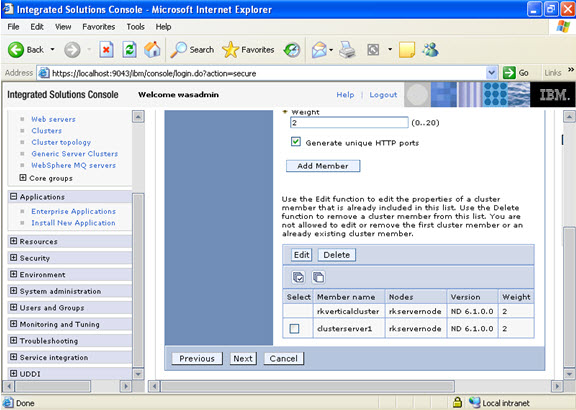
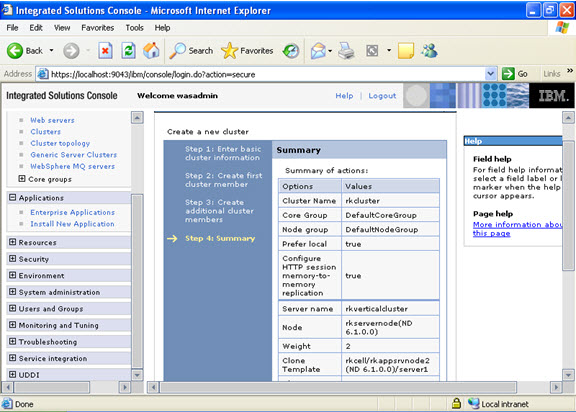
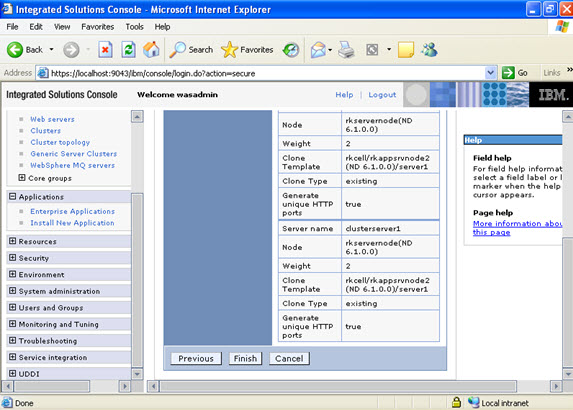
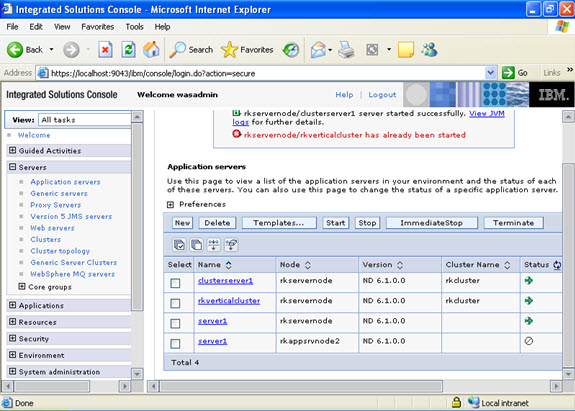
Environment :   Websphere 6.1 Vertical Cluster, 2 JVMS

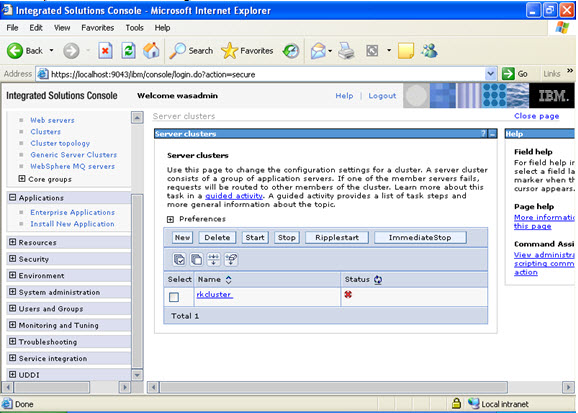
I have websphere servers which time travel in the future. Normally we don’t go forward over an year which is what SSL is valid for but when we cross that date we have problems. The application state changes to “unknown” as nodeagent fails to communicate with dmgr.

Please also read GSK_ERROR_BAD_CERT error configuring SSL between Plug-in and Application Server V6.1

When I tried synchronizing Node Agent with JVMs it returned following error message

When I tried synchronizing Node Agent with JVMs it returned following error message The nodeagent log flashed following messages : tail -f  /opt/IBM/WebSphere/AppServer/profiles/Profile01/Node/logs/nodeagent/SystemOut.log

[12/04/11 06:58:23:313 BST] 00000017 WSX509TrustMa E CWPKI0311E: The certificate with subject DN CN=172.30.9.24, O=IBM, C=US has a start date Fri Aug 12 01:35:46 BST 2011 which is valid after the current date/time.  This will can happen if the client’s clock is set earlier than the server’s clock.   Please verify the clocks are in sync between this client and server and retry the request. Forwarded IOR failed with: CAUGHT_EXCEPTION_WHILE_CONFIGURING_SSL_CLIENT_SOCKET: JSSL0080E: javax.net.ssl.SSLHandshakeException – The client and server could not negotiate the desired level of security.  Reason: com.ibm.jsse2.util.h: Certificate not valid yet

Easy Solution :

Create new set of SSL certificate else change sysdate to SSL valid date and restart websphere services

If you can’t pickup easiest solution then long  process to correct this issue is below:

I have this issue today again when system was moved to date in the future. Since I have some time in hand , lets find out where things are going wrong.

DMGR LOG ERROR : /opt/IBM/WebSphere/AppServer/profiles/Profile01/dmgr/logs/dmgr/SystemOut.log
[10/23/11 6:42:06:982 BST] 0000001f ORBRas        E com.ibm.ws.security.orbssl.WSSSLClientSocketFactoryImpl createSSLSocket ProcessDiscovery : 0 JSSL0080E: javax.net.ssl.SSLHandshakeException – The client and server could not negotiate the desired level of security.  Reason: com.ibm.jsse2.util.h: No trusted certificate found javax.net.ssl.SSLHandshakeException: com.ibm.jsse2.util.h: No trusted certificate found

NODE LOG Error : /opt/IBM/WebSphere/AppServer/profiles/Profile01/Node/logs/nodeagent/SystemOut.log
[10/23/11 6:42:07:228 BST] 0000001c SystemOut     O CWPKI0022E: SSL HANDSHAKE FAILURE:  A signer with SubjectDN “CN=Server1.domain.com, O=IBM, C=US” was sent from target host:port “172.30.9.63:8879”.  The signer may need to be added to local trust store “/opt/IBM/WebSphere/AppServer/profiles/Profile01/Node/config/cells/Server1_Cell/trust.p12” located in SSL configuration alias “NodeDefaultSSLSettings” loaded from SSL configuration file “security.xml”.  The extended error message from the SSL handshake exception is: “No trusted certificate found”.
[10/23/11 6:42:07:228 BST] 0000001c SystemOut     O
[10/23/11 6:42:07:238 BST] 0000001c ServiceLogger I com.ibm.ws.ffdc.IncidentStreamImpl initialize FFDC0009I: FFDC opened incident stream file /opt/IBM/WebSphere/AppServer/profiles/Profile01/Node/logs/ffdc/nodeagent_0000001c_11.10.23_06.42.07_0.txt

We need to locate how many keystore (key.p12 or similar)  are there under WAS profile.

$ find /opt/IBM/WebSphere/AppServer/profiles/Profile01  -name “key.p12” -type f -ls
738613    4 -rw-rw-r–   1 was61    was61        1554 Jul 13  2010 ./dmgr/etc/key.p12
738621    4 -rw-rw-r–   1 was61    was61        2810 Oct 23 02:02 ./dmgr/config/cells/Server1Cell/key.p12
738624    4 -rw-rw-r–   1 was61    was61        2802 Jul 13  2010 ./dmgr/config/cells/Server1Cell/nodes/Server1Node01/key.p12
1098641    4 -rw-rw-r–   1 was61    was61        1554 Jul 13  2010 ./Node/etc/key.p12
1098643    4 -rw-rw-r–   1 was61    was61        2802 Oct  7  2010 ./Node/config/cells/Server1Cell/key.p12
1098646    4 -rw-rw-r–   1 was61    was61        2802 Jul 13  2010 ./Node/config/cells/Server1Cell/nodes/Server1Node01/key.p12

From the list above it’s clear there is a diff between files at DMGR & Cell level. You can open those keystores using ikeyman to look at SSL certificates in them.

The master key file here is   ./dmgr/config/cells/Server1Cell/key.p12 so I need to manually copy it at other dmgr locations  but not NODEAGENT directories.

[was61@ Profile01]$ cp ./dmgr/config/cells/Server1Cell/key.p12 ./dmgr/config/cells/Server1Cell/nodes/Server1Node01/key.p12
[was61@ Profile01]$ cp ./dmgr/config/cells/Server1Cell/key.p12 ./dmgr/etc/key.p12

[was61@ Profile01]$ find .  -name “key.p12” -type f -ls
212994    4 -rw-rw-r–   1 was61    was61        2810 Oct 24 00:07 ./dmgr/etc/key.p12
738621    4 -rw-rw-r–   1 was61    was61        2810 Oct 23 02:02 ./dmgr/config/cells/Server1Cell/key.p12
738624    4 -rw-rw-r–   1 was61    was61        2810 Oct 24 00:06 ./dmgr/config/cells/Server1Cell/nodes/Server1Node01/key.p12

1098641    4 -rw-rw-r–   1 was61    was61        1554 Jul 13  2010 ./Node/etc/key.p12
1098643    4 -rw-rw-r–   1 was61    was61        2802 Oct  7  2010 ./Node/config/cells/Server1Cell/key.p12
1098646    4 -rw-rw-r–   1 was61    was61        2802 Jul 13  2010 ./Node/config/cells/Server1Cell/nodes/Server1Node01/key.p12

[was61@Server1 Profile01]$ alias dmgrlog
alias dmgrlog=’tail -f /opt/IBM/WebSphere/AppServer/profiles/Profile01/dmgr/logs/dmgr/SystemOut.log’
[was61@Server1 Profile01]$ alias nodelog
alias nodelog=’tail -f /opt/IBM/WebSphere/AppServer/profiles/Profile01/Node/logs/nodeagent/SystemOut.log’
[was61@Server1 Profile01]$ rm /opt/IBM/WebSphere/AppServer/profiles/Profile01/Node/logs/nodeagent/SystemOut.log

[was61@Server1 Profile01]$ /opt/IBM/WebSphere/AppServer/profiles/Profile01/dmgr/bin/startManager.sh
ADMU0116I: Tool information is being logged in file
/opt/IBM/WebSphere/AppServer/profiles/Profile01/dmgr/logs/dmgr/startServer.log
ADMU0128I: Starting tool with the dmgr profile
ADMU3100I: Reading configuration for server: dmgr
ADMU3200I: Server launched. Waiting for initialization status.
ADMU3000I: Server dmgr open for e-business; process id is 17088

[was61@Server1 Profile01]$ cd /opt/IBM/WebSphere/AppServer/profiles/Profile01/Node/bin/
[was61@Server1 bin]$ ./syncNode.sh Server1 8879
ADMU0116I: Tool information is being logged in file
/opt/IBM/WebSphere/AppServer/profiles/Profile01/Node/logs/syncNode.log
ADMU0128I: Starting tool with the Node profile

*** SSL SIGNER EXCHANGE PROMPT ***
SSL signer from target host 172.30.9.63 is not found in trust store /opt/IBM/WebSphere/AppServer/profiles/Profile01/Node/etc/trust.p12.

Here is the signer information (verify the digest value matches what is displayed at the server):
Subject DN:    CN=Server1.domain.com, O=IBM, C=US
Issuer DN:     CN=Server1.domain.com, O=IBM, C=US
Serial number: 1319331734885809000
Expires:       Sun Oct 21 02:02:14 BST 2012
SHA-1 Digest:  F2:BD:CB:E8:28:0B:66:2E:EA:1C:71:BE:0F:D7:24:BB:16:98:54:FF
MD5 Digest:    72:94:EC:FC:9B:10:1A:1E:B6:DF:AA:21:F5:FF:3A:23

Add signer to the trust store now? (y/n) y
A retry of the request may need to occur if the socket times out while waiting for a prompt response.  If the retry is required, note that the prompt will not be redisplayed if (y) is entered, which indicates the signer has already been added to the trust store.
ADMU0401I: Begin syncNode operation for node Server1_Node01 with
Deployment Manager Server1: 8879
ADMU0016I: Synchronizing configuration between node and cell.
ADMU0402I: The configuration for node Server1_Node01 has been synchronized
with Deployment Manager Server1: 8879

Start NodeAgent now and look at nodeagent log for any SSL errors

[was61@Server1 bin]$ /opt/IBM/WebSphere/AppServer/profiles/Profile01/Node/bin/startNode.sh
ADMU0116I: Tool information is being logged in file
/opt/IBM/WebSphere/AppServer/profiles/Profile01/Node/logs/nodeagent/startServer.log
ADMU0128I: Starting tool with the Node profile
ADMU3100I: Reading configuration for server: nodeagent
ADMU3200I: Server launched. Waiting for initialization status.
ADMU3000I: Server nodeagent open for e-business; process id is 17660

Let’s compare again   key SSL files at different directoriesunder dmgr & nodeagent

[was61@Server1 Profile01]$ find .  -name “key.p12” -type f -ls
212994    4 -rw-rw-r–   1 was61    was61        2810 Oct 24 00:07 ./dmgr/etc/key.p12
738621    4 -rw-rw-r–   1 was61    was61        2810 Oct 23 02:02 ./dmgr/config/cells/Server1_Cell/key.p12
738624    4 -rw-rw-r–   1 was61    was61        2810 Oct 24 00:06 ./dmgr/config/cells/Server1_Cell/nodes/Server1_Node01/key.p12
1098641    4 -rw-rw-r–   1 was61    was61        1554 Jul 13  2010 ./Node/etc/key.p12
1098643    4 -rw-rw-r–   1 was61    was61        2810 Oct 23 02:02 ./Node/config/cells/Server1_Cell/key.p12
1098646    4 -rw-rw-r–   1 was61    was61        2810 Oct 24 00:06 ./Node/config/cells/Server1_Cell/nodes/Server1_Node01/key.p12

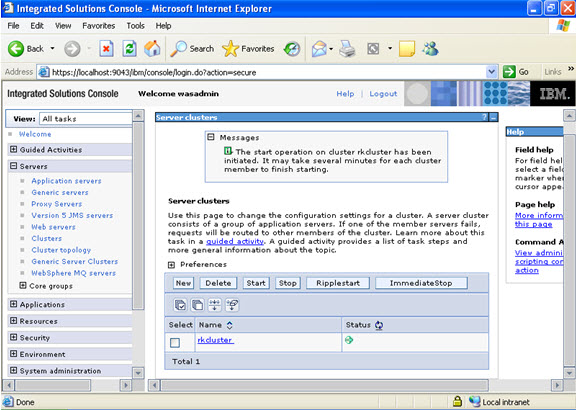
Serverstatus returned following SUCCESSFUL status:

ADMU0116I: Tool information is being logged in file
/opt/IBM/WebSphere/AppServer/profiles/Profile01/Node/logs/serverStatus.log
ADMU0128I: Starting tool with the Node profile
ADMU0503I: Retrieving server status for all servers
ADMU0505I: Servers found in configuration:
ADMU0506I: Server name: server_member2
ADMU0506I: Server name: server_member1
ADMU0506I: Server name: ihs-prpc
ADMU0506I: Server name: nodeagent
ADMU0508I: The Application Server “server_member2” is STARTED
ADMU0508I: The Application Server “server_member1” is STARTED
ADMU0508I: The Web server “ihs-prpc” is RUNNING
ADMU0508I: The Node Agent “nodeagent” is STARTED

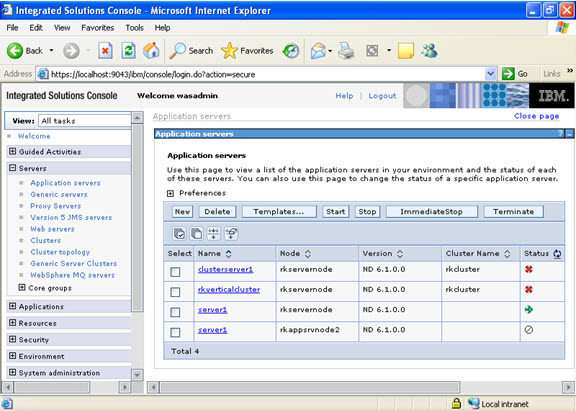
Individual JVMs are working OK. Status is Green than “unknown” listed previously.

DMGR LOG ERROR :
[10/23/11 6:42:06:982 BST] 0000001f ORBRas        E com.ibm.ws.security.orbssl.WSSSLClientSocketFactoryImpl createSSLSocket ProcessDiscovery : 0 JSSL0080E: javax.net.ssl.SSLHandshakeException – The client and server could not negotiate the desired level of security.  Reason: com.ibm.jsse2.util.h: No trusted certificate found javax.net.ssl.SSLHandshakeException: com.ibm.jsse2.util.h: No trusted certificate foundNODE LOG Error
[10/23/11 6:42:07:228 BST] 0000001c SystemOut     O CWPKI0022E: SSL HANDSHAKE FAILURE:  A signer with SubjectDN “CN=eugbbopg11lt.appsdmz.pinnacle.net, O=IBM, C=US” was sent from target host:port “172.30.9.63:8879”.  The signer may need to be added to local trust store “/opt/IBM/WebSphere/AppServer/profiles/Profile01/Node/config/cells/eugbbopg11lt_Cell/trust.p12” located in SSL configuration alias “NodeDefaultSSLSettings” loaded from SSL configuration file “security.xml”.  The extended error message from the SSL handshake exception is: “No trusted certificate found”.
[10/23/11 6:42:07:228 BST] 0000001c SystemOut     O
[10/23/11 6:42:07:238 BST] 0000001c ServiceLogger I com.ibm.ws.ffdc.IncidentStreamImpl initialize FFDC0009I: FFDC opened incident stream file /opt/IBM/WebSphere/AppServer/profiles/Profile01/Node/logs/ffdc/nodeagent_0000001c_11.10.23_06.42.07_0.txt

Oracle FlashBack Error : ORA-16014: log 3 sequence not archived, no available destinations

Posted by Sagar Patil

Number of my systems are on Oracle 10g with flashback Area allocated. The Archive logs , redo logs & backups are destined at this area. This morning users complained about system being down and when I looked at alrtlog I could see archive error.

SQL> show parameter  recovery

NAME                                 TYPE        VALUE

———————————— ———– ——————————

db_recovery_file_dest                string      /u07/backup/oat/flash_recovery_area

db_recovery_file_dest_size     big integer 50G

recovery_parallelism                 integer     0

Let’s have a look at Alrtlog file

SQL> show parameter background

NAME                                 TYPE        VALUE

———————————— ———– ——————————

background_core_dump                 string      partial

background_dump_dest                 string      /u01/app/oracle/product/10.2.0/admin/oat/bdump

Tail alrtlog

ORA-19815: WARNING: db_recovery_file_dest_size of 53687091200 bytes is 99.97% used, and has 14042624 remaining bytes available.

Tue Jun 15 09:52:12 2010

Errors in file /u01/app/oracle/product/10.2.0/admin/at/bdump/oat_arc4_7353.trc:

ORA-16038: log 1 sequence# 7603 cannot be archived

ORA-19815: WARNING: db_recovery_file_dest_size of 53687091200 bytes is 99.97% used, and has 14042624 remaining bytes available.

Tue Jun 15 08:03:57 2010

************************************************************************

You have following choices to free up space from flash recovery area:

1. Consider changing RMAN RETENTION POLICY. If you are using Data Guard,

then consider changing RMAN ARCHIVELOG DELETION POLICY.

2. Back up files to tertiary device such as tape using RMAN

BACKUP RECOVERY AREA command.

3. Add disk space and increase db_recovery_file_dest_size parameter to

reflect the new space.

4. Delete unnecessary files using RMAN DELETE command. If an operating

system command was used to delete files, then use RMAN CROSSCHECK and

DELETE EXPIRED commands.

************************************************************************

SQL> select space_used/(1024*1024),space_limit/(1024*1024) from v$recovery_file_dest;

SPACE_USED/(1024*1024) SPACE_LIMIT/(1024*1024)

———————- ———————–

51200                  51200

Quick Fix :

$ du /u07/backup/oat/flash_recovery_area/OAT/archivelog/  — To locate space used

$ cd /u07/backup/oat/flash_recovery_area/OAT/archivelog/

$ find -name ‘*.arc’ -mtime +2 -exec rm {} \; — Delete archive files older than 2 days

Just deleting archives is no good and we  need to update catalog with deleted file details

$ rman target / nocatalog

RMAN> crosscheck archivelog all;

RMAN> delete noprompt expired archivelog all;

SQL> select space_used/(1024*1024),space_limit/(1024*1024) from v$recovery_file_dest;

SPACE_USED/(1024*1024) SPACE_LIMIT/(1024*1024)

———————- ———————–

2932.44385                   51200

OR Add more space

SQL> select space_used/(1024*1024),space_limit/(1024*1024) from v$recovery_file_dest;

SPACE_USED/(1024*1024) SPACE_LIMIT/(1024*1024)

———————- ———————–

3227.13867                    4032

SQL> ALTER SYSTEM SET DB_RECOVERY_FILE_DEST_SIZE =20G scope=Both sid=’*’;

System altered.

SQL> select space_used/(1024*1024),space_limit/(1024*1024) from v$recovery_file_dest;

SPACE_USED/(1024*1024) SPACE_LIMIT/(1024*1024)

———————- ———————–

3941.9248                   20480


Configuring Websphere Plugin with NAGIOS Monitoring System

Posted by Sagar Patil

1. Download WAS plugin for Nagios from here.

2. Place check_was, check_was-<version>.jar and check_was.profiles in the same directory (e.g. /opt/plugins/custom). Make sure check_was is executable by your Nagios user

For my example here, I have following parameters:

Check_was.sh

#!/bin/sh
PLUGIN_HOME=/home/was61/check_was-0.3
JAVA_HOME=/opt/IBM/WebSphere/AppServer/java
WAS_HOME=/opt/IBM/WebSphere/AppServer

$JAVA_HOME/bin/java -Dplugin.home=”$PLUGIN_HOME” -cp $PLUGIN_HOME/check_was-0.3.jar:$WAS_HOME/runtimes/com.ibm.ws.admin.client_6.1.0.jar:$WAS_HOME/runtimes/com.ibm.ws.webservices.thinclient_6.1.0.jar:$WAS_HOME/plugins/com.ibm.ws.security.crypto_6.1.0.jar com.googlecode.nagioswas.Run $*  2> /dev/null

See relevant Jar files above are at respective directories.

“Server_member1″ is name of Application Server (JVM) so add parameters for each JVM suffixed with name of JVM

# I am running websphere with no ADMIN security enabled
server_member1.hostname=Server1
server_member1.port=8882 (Locate SOAP port number from  (DMGR->Servers -> Relevant Application Server -> Communications -> Ports)
server_member1.username=user1
server_member1.password=abcd
server_member1.securityenabled=false

3. Update check_was by setting the environment variables at the start of the script to the appropriate values for your server.

JAVA_HOME : must point to an IBM JRE/JDK.
WAS_HOME  : needs to point to a directory that contains a directory named “runtimes” containing the following WAS libraries: com.ibm.ws.admin.client_<version>.jar and com.ibm.ws.webservices.thinclient_<version>.jar. If you run the plugin on the same server as WAS, WAS_HOME should point to the WAS install directory.

Edit check_was.servers. This file should contain the configuration to connect to your WAS server.

For each server, the following properties should be provided:
<server alias>.hostname=<the hostname or IP of the WAS server>
<server alias>.port=<the port of the SOAP connector on the server, e.g. 8880>
<server alias>.username=<the admin user name>
<server alias>.password=<the admin password>
<server alias>.securityenabled=<true if security is enabled, false otherwise>
<server alias>.truststore=<the path to the keystore containing the certificated to be used for SSL. If you are running the plugin on your WAS server and use the default WAS keystores, this should point to etc/trust.p12 in your profile>
<server alias>.truststorepassword=<the password for the trust store>
<server alias>.keystore=<the path to the keystore containing the private key to be used for SSL. If you are running the plugin on your WAS server and use the default WAS keystores, this should point to etc/key.p12 in your profile>
<server alias>.keystorepassword=<the password for the key store>

-w sets the threshold percent used for issuing warnings
-c sets the threshold percent used for issuing critical issues
-p sets the server name in check_was.servers to be used
<server name>  : JVM used with scripts stopServer.sh/startServer.sh here server_member1

Monitor JVM heapSize :
JVM heapsize is provided for the entire server. It is measured as: percent used/maximum configured
To Monitor, check_was -s heapsize -w 80 -c 90 -p <server name>

[was61@Server1 check_was-0.3]$ ./check_was -s heapsize -w 80 -c 90 -p server_member1
OK – heapsize: 1048576/2097152 (50.0%)|heapsize=50.0%;80;90;

MonitorLiveSessions :
Live session usage can be monitored for the entire server (all hosts) or with a named host. It is measured as: Number of live sessions

To monitor,
[was61@Server1 check_was-0.3]$ ./check_was -s sessions -w 200 -c 400 -p server_member1
OK – live sessions: total 0, default_hostCTI 0, default_hostprsysmgmt 0, default_hostprweb 0, default_hostprdbutil 0|total=0.0;200;400; default_hostcti=0.0;200;400; default_hostprsysmgmt=0.0;200;400; default_hostprweb=0.0;200;400; default_hostprdbutil=0.0;200;400;

MonitorJdbcConnectionPools:
JDBC connection pool usage can be monitored for the entire server (all connection pools) or with a named connection pool. It is measured as: percent used/maximum configured

To monitor :
[was61@Server1 check_was-0.3]$ ./check_was -s connectionpool -w 80 -c 90 -p server_member
OK – connection pool size: Oracle JDBC Driver 5/100 (5.0%)|oraclejdbcdriver=5.0%;80;90;

MonitorThreadPools :
Thread pool usage can be monitored for the entire server (all thread pools) or with a named thread pool. It is measured as: percent used/maximum configured

To monitor :
[was61@Server1 check_was-0.3]$ ./check_was -s threadpool -w 80 -c 90 -p server_member1
CRITICAL – thread pool size: WebContainer 4/100 (4.0%), SoapConnectorThreadPool 3/5 (60.0%), SIBFAPInboundThreadPool 0/50 (0.0%), HAManager.thread.pool 2/2 (100.0%), MessageListenerThreadPool 0/50 (0.0%), ORB.thread.pool 0/50 (0.0%), SIBFAPThreadPool 2/50 (4.0%), ProcessDiscovery 1/2 (50.0%), TCPChannel.DCS 3/20 (15.0%)|webcontainer=4.0%;80;90; soapconnectorthreadpool=60.0%;80;90; sibfapinboundthreadpool=0.0%;80;90; hamanager_thread_pool=100.0%;80;90; messagelistenerthreadpool=0.0%;80;90; orb_thread_pool=0.0%;80;90; sibfapthreadpool=4.0%;80;90; processdiscovery=50.0%;80;90; tcpchannel_dcs=15.0%;80;90;

Websphere Administrative Security ON/OFF

Posted by Sagar Patil

Instead of

Following setting will be changed at Security.xml :

How to Create and Install websphere Self Signed Certificates

Posted by Sagar Patil

How to create a Singed SSL certificate Requests for RapidSSL,Verisign

Start ikeyman thru HTTPserver/bin

How to use Log Analyzer at IBM Support Assistant Workbench

Posted by Sagar Patil

Now click on Add  to add selected LOG files and then Finish.

You may see dialogue like

Websphere : Node Synchronise problem

Posted by Sagar Patil

I had a strange problem this morning. The clustered JVMs were up but Nodeagent was failing to synchronise with DMGR leaving applications in partial start state.

My attempts to Sync NodeAgent from DMGR were unsuccessful
Dmgr > System administration -> Nodes Select NodeAgent and click on Synchronise else Full Synchronise.

How to Debug this error message?I decided to sync the nodeAgent manually

1. Stop all node-agents that seem broken (that would probably be all of them!).

2. Go to the node agents bin directory on the node (usually something like $WAS_HOME/profiles//bin/).
# Manually sync the node with syncNode.sh, point to the SOAP connector (default is 8879) on the DMGR server.
See example
./syncNode.sh dmgrhost 8879 -username websphere -password webfear
3. Start the node agent and verify that the logs are happy. Kick off a cell sync from dmgr.

Now this came back with some strange error.

I was looking at DMGR logs & Individual JVM logs for an error message but there were 1 line of message dumped at nodelogs (/opt/IBM/WebSphere/AppServer/profiles/Profile01/Node/logs/nodeagent//SystemOut.log ) as below  :

“Global security in the local process is Disabled. Global security in the sending process is Enabled”

What it meant was security at DMGR was enabled but somehow same settings were not there at nodeagent file “security.xml“

./dmgr/config/cells/server1_Cell/security.xml :
useLocalSecurityServer=”true” useDomainQualifiedUserNames=”false” enabled=”true” cacheTimeout=”600″ issuePermissionWarning=”false” activeProtocol=”BOTH” enforceJava2Security=”false” enforceFineGrainedJCASecurity=”false” appEnabled=”false” dynamicallyUpdateSSLConfig=”true” activeAuthMechanism=”LTPA_1″ activeUserRegistry=”WIMUserRegistry_1″ defaultSSLSettings=”SSLConfig_1″>

./Node/config/cells/server1_Cell/security.xml
useLocalSecurityServer=”true” useDomainQualifiedUserNames=”false” enabled=”false” cacheTimeout=”600″ issuePermissionWarning=”true” activeProtocol=”BOTH” enforceJava2Security=”false” enforceFineGrainedJCASecurity=”false” appEnabled=”false” dynamicallyUpdateSSLConfig=”true” activeAuthMechanism=”LTPA_1″ activeUserRegistry=”WIMUserRegistry_1″ defaultSSLSettings=”SSLConfig_1″>

I changed above settings at Node to true and bounced nodeagent and dmgr. The Nodes are now getting sync.

/opt/IBM/WebSphere/AppServer/profiles/Profile01/Node/logs/nodeagent/systemout.log now does say

0000003f NodeSyncTask  A   ADMS0003I: The configuration synchronization completed successfully.

Where to download Websphere Fix Pack

Posted by Sagar Patil

Navigate to http://www-01.ibm.com/support/docview.wss?rs=180&uid=swg24026350

You can click on relevant platform to download packages

For example if you click on Linux it will show following available packages :

If you are unsure, select “Maintenance Download Wizard

Websphere Diagnostic & Tuning Tools : IBM Support Assistant Workbench

Posted by Sagar Patil

Click on relevant Tools to see working example

Read more…

Websphere Garbage Collection : How it's done

Posted by Sagar Patil

This morning I noticed one of my JVM (managed Node) log file native_stderr.log was over grown to 4GB. “tail -f native_stderr.log” was scrolling pages continuously indicating some issue with JVM garbage collection.

In Web applications, memory utilization can impact system performance significantly. One of the most common memory problems is memory leak, which causes severe performance degradation. In theory, memory leaks should not happen in Java™ because it has Garbage Collection (GC). However, GC only cleans up unused objects that are not referenced anymore. Therefore, if an object is not used, but is still referenced, GC does not remove it, which leads to memory leaks. Beside memory leaks, other memory problems that you might encounter are memory fragmentation, large objects, and tuning problems. In many cases, these memory problems can cause the application server to crash. Many users first notice that application server performance gradually declines, and eventually crashes with OutOfMemory exceptions.

<af type=”nursery” id=”5465″ timestamp=”Aug 12 12:42:37 2010″ intervalms=”190.797″>
* type:
* id: The id represents how many times the gc was executed
* intervalms: The time in ms since last time gc was executed
* timestamp: time of gc

<minimum requested_bytes=”168″ />
The minimum represents the number of bytes that were requested and JVM couldnot allocate them so it had to trigger garbage collection cycle.

<time exclusiveaccessms=”0.116″ />
<nursery freebytes=”0″ totalbytes=”57302016″ percent=”0″ />
<tenured freebytes=”1327455816″ totalbytes=”1814672384″ percent=”73″ >
<soa freebytes=”1262687592″ totalbytes=”1742086144″ percent=”72″ />
<loa freebytes=”64768224″ totalbytes=”72586240″ percent=”89″ />
</tenured>
<gc type=”scavenger” id=”5465″ totalid=”5472″ intervalms=”192.634″>
<flipped objectcount=”50598″ bytes=”7341136″ />
<tenured objectcount=”109″ bytes=”12368″ />
<refs_cleared soft=”0″ weak=”0″ phantom=”0″ />
<finalization objectsqueued=”0″ />
<scavenger tiltratio=”85″ />
<nursery freebytes=”49737176″ totalbytes=”57366528″ percent=”86″ tenureage=”14″ />
<tenured freebytes=”1327434760″ totalbytes=”1814672384″ percent=”73″ >
<soa freebytes=”1262666536″ totalbytes=”1742086144″ percent=”72″ />
<loa freebytes=”64768224″ totalbytes=”72586240″ percent=”89″ />
</tenured>
<time totalms=”46.316″ />
</gc>
<nursery freebytes=”49735128″ totalbytes=”57366528″ percent=”86″ />
<tenured freebytes=”1327434760″ totalbytes=”1814672384″ percent=”73″ >
<soa freebytes=”1262666536″ totalbytes=”1742086144″ percent=”72″ /
<loa freebytes=”64768224″ totalbytes=”72586240″ percent=”89″ />
</tenured>
<time totalms=”48.323″ />
</af>

The af element has 3 main child elements first tenured element has data about the tenured memory position before gc then gc element represents data about what happened during gc, such as time spent in mark, sweep and compact phases, The second tenured element represents the position of tenured memory after gc.
The IBM Support assistance has IBM Pattern modeling and Analysis tool for Java Garbage collection tool that can be used to analyze the garbage collection.

WebSphere Security: Switch off username/password prompt while shutting down services

Posted by Sagar Patil

In previous releases of WebSphere Application Server, when global security was enabled, both administrative and application security were enabled. In WebSphere Application Server V6.1, the concept of global security is split into administrative security and application security, of which each component can be enabled separately. Application security provides application isolation and requirements for authenticating users for the applications in your environment.

When global security is enabled, the application has to provide the right user name and password to be able to run the scripts. It could be achived by 2 ways , using 1)Remote Method Invocation (RMI) connector , or 2) a SOAP connector:

The sas.client.props (RMI) and the soap.client.props (SOAP) files are located in $PROFILE_ROOT/properties directory for each WebSphere Application Server profile:

1) Using RMI method with wsadmin

Amend following properties in sas.client.props file :

com.ibm.CORBA.loginSource=properties  — change from Prompt (Default)
com.ibm.CORBA.loginUserid=wsadmin
com.ibm.CORBA.loginPassword=wsadmin1234

wsadmin -conntype RMI -port 2809

2) Using SOAP Connector method

was61@properties]$ /opt/IBM/WebSphere/AppServer/profiles/Profile01/Node/bin/stopServer.sh  server_member1
ADMU0116I: Tool information is being logged in file
/opt/IBM/WebSphere/AppServer/profiles/Profile01/Node/logs/server_member1/stopServer.log
ADMU0128I: Starting tool with the Node profile
ADMU3100I: Reading configuration for server: server_member1
Realm/Cell Name: <default>
Username: wsadmin
Password:

To switch off username /password prompt while shutting down WAS services , edit $WAS_HOME/node/properties/soap.client.props

vi soap.client.props
com.ibm.SOAP.loginUserid=wsadmin
com.ibm.SOAP.loginPassword=wsadmin1234

Here is the result

[was61@properties]$ /opt/IBM/WebSphere/AppServer/profiles/Profile01/Node/bin/stopServer.sh server_member1
ADMU0116I: Tool information is being logged in file
/opt/IBM/WebSphere/AppServer/profiles/Profile01/Node/logs/server_member1/stopServer.log
ADMU0128I: Starting tool with the Node profile
ADMU3100I: Reading configuration for server: server_member1
ADMU3201I: Server stop request issued. Waiting for stop status.
ADMU4000I: Server server_member1 stop completed.

To switch off password prompt while shutting down dmgr you will need soap.client.props modified at $WAS_HOME/Dmgr/properties/

Websphere HTTP plugin failover in a clustered environment

Posted by Sagar Patil

We have a Websphere 6.1 vertical cluster i.e 2 JVMs in a single physical machine with IBM HTTP server.

Problem : Users complained  Http server is not properly failing connections when one of the JVM is hung/not responding

Background : In clustered IBM WebSphere Application Server environments, the HTTP plug-in has the ability to provide failover in the event the HTTP plug-in is no longer able to send requests to a particular cluster member. By default, there are several conditions under which the HTTP plug-in will mark a particular cluster member down and failover client requests to another cluster member that is still able to receive connections. They are listed as follows:

  • The HTTP plug-in is unable to establish a connection to a cluster member’s Application Server transport.
  • The HTTP plug-in detects a newly connected socket that was prematurely closed by a cluster member during an active read or write.

There are several configurable settings in the plugin-cfg.xml that can be tuned to affect how quickly the HTTP plug-in will mark a cluster member down and failover to another cluster member.

Sample $HTTP_HOME/Plugins/config/Plugin-cfg.xml file

<ServerCluster CloneSeparatorChange=”false” GetDWLMTable=”false” IgnoreAffinityRequests=”true” LoadBalance=”Round Robin” Name=”server1_cluster” PostBufferSize=”64″ PostSizeLimit=”-1″ RemoveSpecialHeaders=”true” RetryInterval=”60″>
<Server CloneID=”14l574lkv” ConnectTimeout=”0″ ExtendedHandshake=”false” LoadBalanceWeight=”2″ MaxConnections=”-1″ Name=”Server1_Node01_ihs_member1″ ServerIOTimeout=”0″ WaitForContinue=”false”>
<Transport Hostname=”Server1″ Port=”9080″ Protocol=”http”/>
<Transport Hostname=”Server1″ Port=”9443″ Protocol=”https”>
<Property Name=”keyring” Value=”/opt/IBM/WebSphere/Plugins/config/ihs/plugin-key.kdb”/>
</Transport>
</Server>
<Server CloneID=”14l574mci” ConnectTimeout=”0″ ExtendedHandshake=”false” LoadBalanceWeight=”2″ MaxConnections=”-1″ Name=”Server1_Node01_ihs_member2″ ServerIOTimeout=”0″ WaitForContinue=”false”>
<Transport Hostname=”Server1″ Port=”9081″ Protocol=”http”/>
<Transport Hostname=”Server1″ Port=”9444″ Protocol=”https”>
<Property Name=”keyring” Value=”/opt/IBM/WebSphere/Plugins/config/ihs/plugin-key.kdb”/>
</Transport>
</Server>
<PrimaryServers>
<Server Name=”Server1_Node01_ihs_member1″/>
<Server Name=”Server1_Node01_ihs_member2″/>
</PrimaryServers>
</ServerCluster>

ConnectTimeout Setting:
It is possible to add an attribute to the Server element called ConnectTimeout, which makes the plug-in use a non-blocking connect. Setting ConnectTimeout to a value of 0 is equal to not specifying the ConnectTimeout attribute, that is, the plug-in performs a blocking connect and waits until the operating system times out. Set this attribute to an integer value greater than zero to determine how long the plug-in should wait for a response when attempting to connect to a server. A setting of 10 will mean that the plug-in waits for ten seconds to time out.

Without ConnectTimeout http server will have to wait for OS timeout interval which will run into several minutes. This setting is very similar to ORACLE RAC VIP settings where oracle uses VIPs to detect timeouts/failover quickly over using OS or network interval.

ServerIOTimeout:
The ServerIOTimeout attribute of a server element enables the HTTP plug-in to set a time out value, in seconds, for sending requests to and reading responses from a cluster member. If a value is not set for the ServerIOTimeout attribute, the HTTP plug-in, by default, uses blocked I/O to write request to and read responses from the cluster member until the TCP connection times out.

RetryInterval:
An integer specifying the length of time that should elapse from the time that a server is marked down to the time that the HTTP plug-in will retry a connection. The default is 60 seconds.

As you can see , both settings ConnectTimeout & ServerIOTimeout are not set in this environment. For additional details visit http://www-01.ibm.com/support/docview.wss?uid=swg21219808

How to Analyze JVM logs (SystemOut.log, SystemErr.log & startServer.log)

Posted by Sagar Patil

Websphere writes formatted text log messages to SystemOut.log,SystemErr.log & startServer.log files.

Sample SystemOut.log

[14/08/11 07:06:54:204 BST] 0000000a ManagerAdmin  I   TRAS0017I: The startup trace state is *=info.
[14/08/11 07:06:54:683 BST] 0000000a ManagerAdmin  I   TRAS0111I: The message IDs that are in use are deprecated

[14/08/11 07:06:55:606 BST] 0000000a FileRepositor A   ADMR0010I: Document cells/server1_Cell/nodes/server1_Manager/node-metadata.properties is modified.

[14/08/11 07:06:57:823 BST] 0000000a ThreadPoolMgr W   WSVR0626W: The ThreadPool setting on the ObjectRequestBroker service is deprecated.

[21/05/10 10:02:56:240 BST] 00000012 TCPPort       E   TCPC0003E: TCP Channel TCP_5 initialization failed.  The socket bind failed for host * and port 9352.  The port may already be in use.
[21/05/10 10:02:56:244 BST] 00000012 TCPPort       E   TCPC0003E: TCP Channel TCP_5 initialization failed.  The socket bind failed for host * and port 9352.  The port may already be in use.

[15/08/11 03:49:59:333 BST] 0000003c SystemOut     O Debug options: file:/opt/IBM/WebSphere/AppServer/profiles/Profile01/dmgr/.options not found
[15/08/11 03:49:59:512 BST] 0000003c SystemOut     O Need to load org.eclipse.osgi.framework.internal.protocol.reference.Handler
[15/08/11 03:49:59:585 BST] 0000003c SystemOut     O Time to load bundles: 76

# Time Stamp: The first part of the log message in sample code is  [15/08/11 03:49:59:585 BST]. It is the time stamp when the message was written. The time stamp is formatted using the locale of the process and it is 24 hour time stamp with milli-second precision

# Thread ID : The next part in the log message is 00000012 /0000003c , which represents the thread id. The thread ID is an eight-character hexadecimal value that is generated from the hash code of the thread that issued the message

# Short name : The short name is the abbreviated name of the component that issued the message. This name is typically the class name of a WAS component and would be some other identifier for the application. here ThreadPoolMgr , FileRepositor , TCPPort etc

# Event Type: The event type is a one character field that indicates the type of the message. The possible values are
* F- Fatal message
* E- Error message
* W- Warning message
* A- Audit message
* I- Informational message
* C- Configuration message
* D- detail message
* O- Messages that are written directly to System.out by an application or server component
* R- Messages that are written directly to System.err by the user application or internal component.
* Z- Place holder to indicate type was not recognized

# Message identifier (TCPC0003E/WSVR0626W/ADMR0010I): The message identifier is a string that is nine characters in length and is in the form CCCC1234X. The first four characters indicate the WAS component that issues the message. The next four characters indicate the specific message that component is issuing. The last character indicates the severity of the message. Its value is either I- informational, W- Warning or E error.

# Message: The message is the data that is logged to the SystemOut.log by the component

Sample SystemErr.log

[21/05/10 10:06:22:772 BST] 0000002b SystemErr     R Warning: unable to load “pr3native” library (using path: /opt/IBM/WebSphere/AppServer/java/jre/bin:/opt/IBM/WebSphere/AppServer/bin::/usr/lib:/opt/IBM/WebSphere/AppServer/lib/WMQ/java/lib) Root cause: pr3native (Not found in java.library.path)
[21/05/10 10:07:43:844 BST] 00000036 SystemErr     R 21-May-2010 10:07:43 com.pega.pegarules.ra.priv
INFO: Attempting to connect to JMS queue for asynchronous task execution

Sample startServer.log

************* End Display Current Environment *************
[21/05/10 10:02:41:607 BST] 0000000a ManagerAdmin  I   TRAS0017I: The startup trace state is *=info.
[21/05/10 10:02:41:671 BST] 0000000a AdminTool     A   ADMU0128I: Starting tool with the dmgr profile
[21/05/10 10:02:41:673 BST] 0000000a AdminTool     A   ADMU3100I: Reading configuration for server: dmgr
[21/05/10 10:02:43:570 BST] 0000000a AdminTool     A   ADMU3200I: Server launched. Waiting for initialization status.
[21/05/10 10:03:04:866 BST] 0000000a AdminTool     A   ADMU3000I: Server dmgr open for e-business; process id is 902

Diagnosing IBM Websphere Service logs

Posted by Sagar Patil

The IBM service log
The IBM service log, referred to as the service log, is a binary file. It contains information written to System.out by the Application Server run time as well as special messages that contain extended service information. This extended service information has been useful to IBM WebSphere Service teams in solving complex problems. IBM has now created additional tools to decipher these binary service logs, such as the Log Analyzer in Application Server. However, it is best to solve as many problems as possible during the development phase, before deploying to a production Application Server environment.

The service logs (activity.log) are normally located at $WAS_HOME/Profiles/dmgr/logs & $WAS_HOME/Profile/Node/Logs

[was61@Profile01]$ pwd
/opt/IBM/WebSphere/AppServer/profiles/Profile01
[was61@Profile01]$ du -a | grep activity.log
724     ./dmgr/logs/activity.log
2052    ./Node/logs/activity.log

Using showlog to see contents of Service log (activity.log)
You can find the showlog tool inside the WebSphere/AppServer/bin folder. If you execute it without arguments it will print out help for that tool

[was61@Profile01]$ /opt/IBM/WebSphere/AppServer/bin/showlog ./dmgr/logs/activity.log | more
$LANG = en_GB
$CODESET = UTF-8
—————————————————————
ComponentId:     Application Server
ProcessId:       26053
ThreadId:        0000000a
ThreadName:      main
SourceId:        com.ibm.ws.management.AdminInitializer
ClassName:
MethodName:
Manufacturer:    IBM
Product:         WebSphere
Version:         Platform 6.1 [ND 6.1.0.31 cf311015.02]
ServerName:      Cell\_Manager\dmgr
TimeStamp:       2011-08-14 07:06:54.943000000
UnitOfWork:
Severity:        3
Category:        AUDIT
PrimaryMessage:  ADMN0015I: The administration service is initialized.
…………………..


Setting the session timeout for the administrative console

Posted by Sagar Patil

1.  Edit the ${WAS_HOME}/systemApps/adminconsole.ear/deployment.xml file in a text editor.

2. Locate the xml statement <tuningParams xmi:id=”TuningParams_1088453565469″ maxInMemorySessionCount=”1000″ allowOverflow=”true” writeFrequency=”TIME_BASED_WRITE” writeInterval=”10″ writeContents=”ONLY_UPDATED_ATTRIBUTES” invalidationTimeout=”30″>

3. Change the invalidationTimeout value to the desired session timeout. The default is 30.

4. Save the ${WAS_HOME}/systemApps/adminconsole.ear/deployment.xml file.

5. Restart the deployment manager

Websphere File Synchronization Service: Replicate changes from Dmgr to NodeAgent

Posted by Sagar Patil

In a distributed server environment, the administrative console is located in the deployment manager server, dmgr. In this case, the administrative console provides centralized administration of multiple nodes. Configuration changes are made to the master repository and pushed to the local repositories on the nodes by the deployment manager. In order for the administrative console to run, the dmgr server must be running. In order for the changes to the master repository to be pushed to the nodes, the node agents must also be running.

The file synchronization service is the administrative service responsible for keeping up to date the configuration and application data files that are distributed
across the cell. The service runs in the deployment manager and node agents, and ensures that changes made to the master repository will be propagated out to the nodes, as necessary. The file transfer system application is used for the synchronization process. File synchronization can be forced from an administration client, or can be scheduled to happen automatically.

During the synchronization operation, the node agent checks with the deployment manager to see if any files that apply to the node have been updated in the master repository. New or updated files are sent to the node, while any deleted files are also deleted from the node.

Synchronization is one-way. The changes are sent from the deployment manager to the node agent. No changes are sent from the node agent back to the deployment manager

You can configure the File Synchronization service from the WAS Admin Console like this->

System administration -> Node Agents -> $NodeAgent->Configuration -> File synchronization service -> Automatic synchronization

Options Available

Automatic Synchronization : Specifies whether to synchronize files automatically after a designated interval. When this setting is enabled, the node agent automatically contacts the deployment manager every synchronization interval to attempt to synchronize the node’s configuration repository with the master repository owned by the deployment manager. If the Automatic synchronization setting is enabled, the node agent attempts file synchronization when it establishes contact with the deployment manager. The node agent waits the synchronization interval before it attempts the next synchronization.

Startup Synchronization : Specifies whether the node agent attempts to synchronize the node configuration with the latest configurations in the master repository prior to starting an application server. The default is to not synchronize files prior to starting an application server. Enabling the setting ensures that the node agent has the latest configuration but increases the amount of time it takes to start the application server.

Logging commands executed through Websphere(WAS) Admin Console

Posted by Sagar Patil

Use this feature if you want to log or capture “wsadmin” commands excuted by WAS internally. It can be very useful when you want to automate your tasks and don’t know exact wsadmin syntaxes to use.

A logging could be enabled by 2 ways:

View Administrative scripting command for last action:
* Every time you perform an action a “View Administrative scripting command for last action” link shows up on the right hand side, if you click on the link a dialog box will open with the wasadmin command that is executed to perform the action

I navigated to DMGR-> “Applications” ->  Enterprise Applications -> At right hand Side I can see “View administrative scripting command for last action”
A click at View administrative scripting command for last action shows:
Administrative Scripting Command
AdminApp.list()

Log command assistance commands:
* You can enable the option “Log command assistance commands” at DMGR -> System administration -> preference. Once you do that every time you perform action in WAS Admin command the equivalent command will get saved in the log file.

Enable command assistance notifications
Specifies whether to send Java Management Extensions (JMX) notifications that contain command assistance data from the administrative console. Enablement of the notifications allows integration with product tools such as the WebSphere Application Server Toolkit (AST) Jython editor. Enablement of this option is recommended for non-production environments only.
Default     false (cleared)

Log command assistance commands
Specifies whether to log all the command assistance wsadmin data to a file. This file is saved to ${LOG_ROOT}/server/commandAssistanceJythonCommands_user name.log , where:
* server is the server process where the console runs, such as dmgr or server1.
* user name is the administrative console user name.
Occasionally clean out the file to manage its growth.

After i turned the preference on, i went to WAS Admin console and stopped my JVM. Then i went to dmgr_profile_root/logs directory and i could see commandAssistanceJythonCommands_patilsa.log file like this.

[was61@dmgr]$ ls -lrt
-rw-r–r– 1 was61 was61     5 Aug 14 07:07 dmgr.pid
-rw-r–r– 1 was61 was61   138 Aug 15 03:51 commandAssistanceJythonCommands_patilsa.log
-rw-r–r– 1 was61 was61 38373 Aug 15 03:52 SystemOut.log

vi commandAssistanceJythonCommands_patilsa.log

# [15/08/11 03:56:33:300 BST] ApplicationDeployment
AdminApp.list()

# [15/08/11 03:57:22:059 BST] Server status feedback
AdminControl.invoke(‘WebSphere:name=server_member2,process=server_member2,platform=proxy,node=Server1_Node01,j2eeType=J2EEServer,version=6.1.0.31,type=Server,mbeanIdentifier=cells/Server1_Cell/nodes/Server1_Node01/servers/server_member2/server.xml#Server_1259674426040,cell=Server1_Cell,spec=1.0,processType=ManagedProcess’, ‘stop’)

# [15/08/11 03:59:50:263 BST] Application servers
AdminControl.invoke(‘WebSphere:name=NodeAgent,process=nodeagent,platform=common,node=Server1_Node01,diagnosticProvider=true,version=6.1.0.31,type=NodeAgent,mbeanIdentifier=NodeAgent,cell=Server1_Cell,spec=1.0’, ‘launchProcess’, ‘[server_member2]’, ‘[java.lang.String]’)

Where is Websphere profile config stored

Posted by Sagar Patil

Use profileRegistry.xml file to locate name of profiles on system. File normally located at /opt/IBM/WebSphere/AppServer/properties

<?xml version=”1.0″ encoding=”UTF-8″?>
<profiles>
<profile isAReservationTicket=”false” isDefault=”true” name=”Dmgr” path=”/opt/IBM/WebSphere/AppServer/profiles/Profile61/Dmgr” template=”/opt/IBM/WebSphere/AppServer/profileTemplates/cell/dmgr”/>
<profile isAReservationTicket=”false” isDefault=”false” name=”Node” path=”/opt/IBM/WebSphere/AppServer/profiles/Profile61/Node” template=”/opt/IBM/WebSphere/AppServer/profileTemplates/cell/default”/>
</profiles>

Websphere Routing a Request using Plugin-cfg.xml

Posted by Sagar Patil

The Web Server plug-in uses an XML configuration file to determine whether a request is for the Web Server of the application server. When a request reaches the Web Server, the URL is compared to those managed by the plug-in. If a match is found, the plug-in configuration file contains the information needed to forward the request to the web container using the web container inbound chain.

For example lets say you make a request to http://localhost/help/SessionAffinityServlet URL, so the Web Server Plugin will check /prhelp URL to find out how it is should be handled.  It will check if there is matching UriGroup element in plugin-cfg.xml

<UriGroup Name=”default_host_test_cluster_URIs”>
<Uri AffinityCookie=”JSESSIONID” AffinityURLIdentifier=”jsessionid” Name=”/util/*”/>
<Uri AffinityCookie=”JSESSIONID” AffinityURLIdentifier=”jsessionid” Name=”/web/*”/>
<Uri AffinityCookie=”JSESSIONID” AffinityURLIdentifier=”jsessionid” Name=”/help/*”/>
<Uri AffinityCookie=”JSESSIONID” AffinityURLIdentifier=”jsessionid” Name=”/sysmgmt/*”/>
</UriGroup>

In this case it knows that /help/* URL is for dynamic content, so next part is how to route it to correct server.?

It will now read value of Name attribute for UriGroup which is default_host_cluster1_URIs, and name of cluster “cluster1”. It will use these values find out virtual host and the cluster.

It can see the test_cluster has two servers  Server1_Node01_test_server_member1  and   Server1_Node01_test_server_member2 . From the cluster definition it can locate http and https port to forward request to either of the server. The cluster definition also says that the Load balancing algorithm is Round robin.

Sample complete Plugin-cfg.xml

<Config ASDisableNagle=”false” AcceptAllContent=”false” AppServerPortPreference=”HostHeader” ChunkedResponse=”false” FIPSEnable=”false” IISDisableNagle=”false” IISPluginPriority=”High” IgnoreDNSFailures=”false” RefreshInterval=”60″ ResponseChunkSize=”64″ VHostMatchingCompat=”false”>
<Log LogLevel=”debug” Name=”/opt/IBM/HTTPServer/Plugins/logs/ihs-prpc/http_plugin.log”/>
<Property Name=”ESIEnable” Value=”true”/>
<Property Name=”ESIMaxCacheSize” Value=”1024″/>
<Property Name=”ESIInvalidationMonitor” Value=”false”/>
<Property Name=”ESIEnableToPassCookies” Value=”false”/>
<VirtualHostGroup Name=”default_host”>
<VirtualHost Name=”*:9080″/>
<VirtualHost Name=”*:80″/>
<VirtualHost Name=”*:9443″/>
<VirtualHost Name=”*:5060″/>
<VirtualHost Name=”*:5061″/>
<VirtualHost Name=”*:443″/>
<VirtualHost Name=”*:9081″/>
<VirtualHost Name=”*:9444″/>
</VirtualHostGroup>
<ServerCluster CloneSeparatorChange=”false” GetDWLMTable=”false” IgnoreAffinityRequests=”true” LoadBalance=”Round Robin” Name=”test_cluster” PostBufferSize=”64″ PostSizeLimit=”-1″ RemoveSpecialHeaders=”true” RetryInterval=”60″>
<Server CloneID=”1411a9de8″ ConnectTimeout=”0″ ExtendedHandshake=”false” LoadBalanceWeight=”2″ MaxConnections=”-1″ Name=”Server1_Node01_test_server_member1″ ServerIOTimeout=”0″ WaitForContinue=”false”>
<Transport Hostname=”10.0.0.100″ Port=”9080″ Protocol=”http”/>
<Transport Hostname=”10.0.0.100″ Port=”9443″ Protocol=”https”>
<Property Name=”keyring” Value=”/opt/IBM/WebSphere/Plugins/config/ihs-prpc/plugin-key.kdb”/>
<Property Name=”stashfile” Value=”/opt/IBM/WebSphere/Plugins/config/ihs-prpc/plugin-key.sth”/>
</Transport>
</Server>
<Server CloneID=”1411a9dt5″ ConnectTimeout=”0″ ExtendedHandshake=”false” LoadBalanceWeight=”2″ MaxConnections=”-1″ Name=”Server1_Node01_test_server_member2″ ServerIOTimeout=”0″ WaitForContinue=”false”>
<Transport Hostname=”10.0.0.100″ Port=”9081″ Protocol=”http”/>
<Transport Hostname=”10.0.0.100″ Port=”9444″ Protocol=”https”>
<Property Name=”keyring” Value=”/opt/IBM/WebSphere/Plugins/config/ihs-prpc/plugin-key.kdb”/>
<Property Name=”stashfile” Value=”/opt/IBM/WebSphere/Plugins/config/ihs-prpc/plugin-key.sth”/>
</Transport>
</Server>
<PrimaryServers>
<Server Name=”Server1_Node01_test_server_member1″/>
<Server Name=”Server1_Node01_test_server_member2″/>
</PrimaryServers>
</ServerCluster>
<UriGroup Name=”default_host_test_cluster_URIs”>
<Uri AffinityCookie=”JSESSIONID” AffinityURLIdentifier=”jsessionid” Name=”/prdbutil/*”/>
<Uri AffinityCookie=”JSESSIONID” AffinityURLIdentifier=”jsessionid” Name=”/prweb/*”/>
<Uri AffinityCookie=”JSESSIONID” AffinityURLIdentifier=”jsessionid” Name=”/prhelp/*”/>
<Uri AffinityCookie=”JSESSIONID” AffinityURLIdentifier=”jsessionid” Name=”/prsysmgmt/*”/>
</UriGroup>
<Route ServerCluster=”test_cluster” UriGroup=”default_host_test_cluster_URIs” VirtualHostGroup=”default_host”/>
<RequestMetrics armEnabled=”false” loggingEnabled=”false” rmEnabled=”false” traceLevel=”HOPS”>
<filters enable=”false” type=”URI”>
<filterValues enable=”false” value=”/snoop”/>
<filterValues enable=”false” value=”/hitcount”/>
</filters>
<filters enable=”false” type=”SOURCE_IP”>
<filterValues enable=”false” value=”255.255.255.255″/>
<filterValues enable=”false” value=”254.254.254.254″/>
</filters>
<filters enable=”false” type=”JMS”>         <filterValues enable=”false” value=”destination=aaa”/>
</filters>
<filters enable=”false” type=”WEB_SERVICES”>
<filterValues enable=”false” value=”wsdlPort=aaa:op=bbb:nameSpace=ccc”/>
</filters>
</RequestMetrics>
</Config>

Websphere : Deploy/Update J2EE Application using GUI Deployment Manager

Posted by Sagar Patil

Stop the application

clip_image006 Click on application and select UPDATE clip_image008 Scroll Down and hit NEXT clip_image010 Keep default options and hit next clip_image012 clip_image014 Select where you want top deploy this application. I have one Cluster and 2 HTTP servers so I have selected respective nodes in screen above. clip_image016 Click on finish to see the progress clip_image018 We can select Save here and then start an application but I will select ROLLOUT update here. Let’s see what happens next clip_image020 clip_image022 I used “ptree –a” to locate if I can see any STOP /START server commands but it didn’t show relevant details. The Application was also down during this process though HTTP server was up and running. clip_image024 Please wait until you see message “Application Rollout succeeded” Click on continue and navigate to application servers clip_image026 clip_image028 Once servers are up validate application is also up & running before releasing system to users. clip_image030

How to Install SSL certificate under Websphere/Http server

Posted by Sagar Patil

1. Navigate to the /bin-directory of your IHS-Installation $IHS_HOME

2. execute ./ikeyman to open Key Management Tool

clip_image002[4]
3. Use “Key Database File > Open” to open your password-protected Key-Database

clip_image004[4]
4. After Key-Database is loaded switch to “Personal Certificate Requests” (under “Key database content”).

clip_image006[4]

5. Click New and fill out the certificate request dialog. Depending on your CA-Provider (RapidSSL here) you may need to fill out the dialog in a special way (VeriSign demands the common name to be the domain)

6. Click “OK” to save the certificate request in a file

clip_image010[4]
7. Now you need to provide content of certificate request file to your Ceritifcate Authority (e.g.: RapidSSL). You will receiving a new certificate file from them.

clip_image012[4]

8. Once you have received certificate switch back to ikeyman->”Personal Certificates” (under “Key database content”)

9. Click Receive and navigate to certificate file. Click Ok to import certificate file.

10. Open httdp.conf File of your IHS and replace SSL-Cert-Name (name will be displayed after the import of new certificate in iKeyman).
Usally a SSL-Cert is definded within a virtual host:
Example:
<VirtualHost “ip-adress”:443>
ServerName www.test.com
SSLEnable
SSLClientAuth 0
SSLServerCert ihssslcert
AllowEncodedSlashes On

DocumentRoot /usr/IBM/HTTPServer/www-doc-root/
</VirtualHost>

11. Restart the IHS-Server
$/opt/IBM/HTTPServer/bin/apachectl stop
$ps -ef | grep httpd (Should return NO results)

/opt/IBM/HTTPServer/bin/apachectl start

$ ps -ef | grep httpd (Should return results like below)
root 13608 1 0 16:06 ? 00:00:00 /opt/IBM/HTTPServer/bin/httpd -d /opt/IBM/HTTPServer -k start
nobody 13610 13608 0 16:06 ? 00:00:00 /opt/IBM/HTTPServer/bin/httpd -d /opt/IBM/HTTPServer -k start
nobody 13611 13608 0 16:06 ? 00:00:00 /opt/IBM/HTTPServer/bin/httpd -d /opt/IBM/HTTPServer -k start
nobody 13612 13608 0 16:06 ? 00:00:00 /opt/IBM/HTTPServer/bin/httpd -d /opt/IBM/HTTPServer -k start

Check the $IHS_HOME/logs/error_log file to see any SSL handshake errors

Websphere Application Server Clusters

Posted by Sagar Patil

Clusters

Logical grouping of application servers is called clusters. Instead of installing an application on individual server we can install it on a cluster to automatically deploy application on each application cluster.

Vertical cluster: When cluster members are defined on the same physical machine
Horizontal cluster: When the cluster members are defined on different physical machines

Plugin-cfg.xml

This file contains the necessary information to help the plugin module on  how to work load manage the requests.

Here we will look at a Vertical cluster:

Connect to the deployment manager admin console. Servers -> application servers -> server1.

We are using this application server1 as the template for the cluster we  create. All the cluster members will be identical to this application server.

The following applications will be deployed on the cluster and load balanced by cluster for performance and availability.

Click servers -> clusters -> new ->

Prefer local; it will improve performance in the clustered environment.

Now select the cluster members.

Note: select the node on which the previous cluster you have created.

Select generate unique http ports.

And click add member.

See the summary details.

Click finish, save the configuration when prompted. When you save, the following screen is

To verify cluster configuration and plugin work load management:

Deployment manager admin console -> servers -> clusters

Click on servers -> application servers ->

Now you see the cluster members you have created.

Check the cluster member and the names of the cluster and understand.

Select the cluster and click the start button to start the cluster.

Select servers -> application servers -> and check whether the cluster servers are started.

Now expand servers -> select web servers -> and click generate plug-in to generate the plugin representing the cluster environment.

And bounce the server once.


Now issue the following command in the browser and see which server is supplying the request.

For this you need to check the ServletContextAttributes

Top of Page

Top menu