Websphere Silent Installation

Posted by Sagar Patil

Websphere Silent installation consists oof 3 stages. You need to successfully complete all of these.

  1. Base installation
  2. IBM Http server
  3. Plugin Software installation

The command “netstat –a” is used to find out the port numbers which are being used.

Silent Installation of Base

Go to the software 6.0 base/WAS. In the WAS console there will be a file named responsefile.base. Open it using editor.

Hints: node name can be any name

Check the port numbers, it should not be repeated.

The host name happens to be the name of the computer

-W nodehostandcellnamepanelInstallWizardBean.hostName=”rk”,

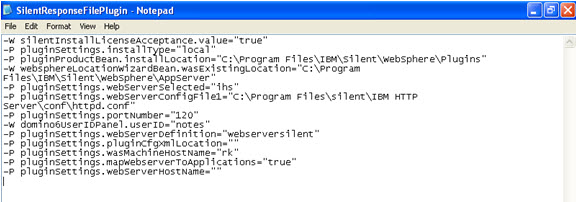
Prepare the silent response file as follows.

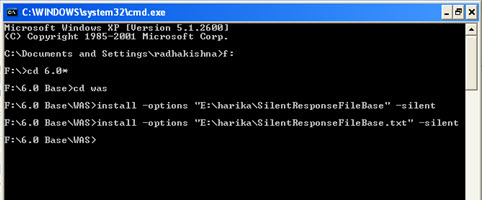
Now go to the command prompt and to the software where home is installed and type the following command:

WAS >install –options “the response file address.txt” –silent

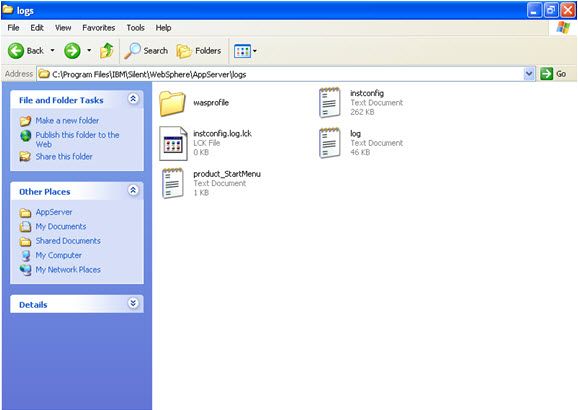
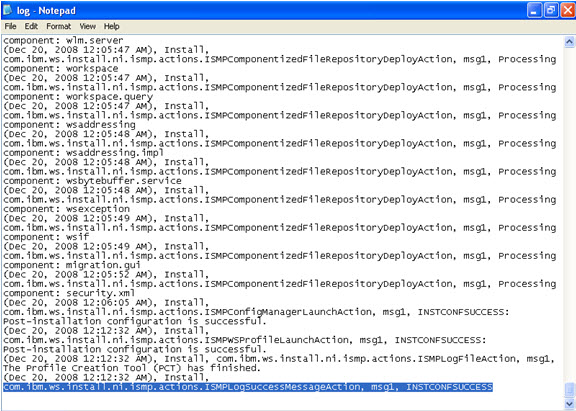
Now in the log file of the logs folder, the following message should appear:

com.ibm.ws.install.ni.ismp.actions.ISMPLogSuccessMessageAction, msg1, INSTCONFSUCCESS

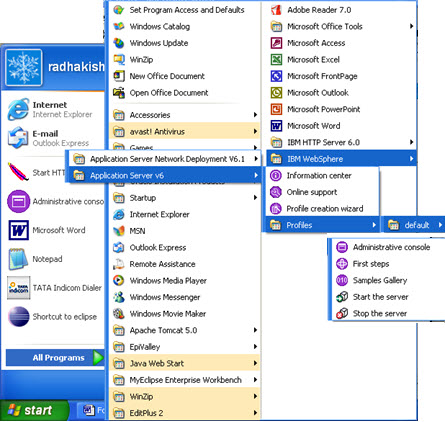
Also check that in the program files, entry of the Application server base is also Added V6.

Silent install of IBM HTTP SERVER:

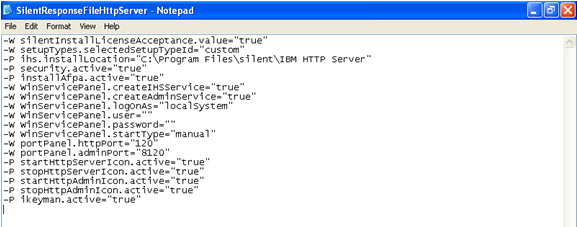
Locate response file .6.0/base/response file. Now open  response file, and  copy the required commands from the response file, and save the response file.

Here, I have changed the port numbers, so be careful with the port numbers. If the port numbers are being used, then there will be a problem in the installation.

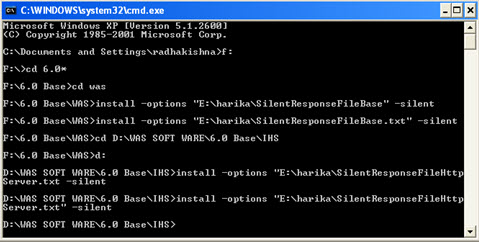
\Go to the command prompt and issue the following command:

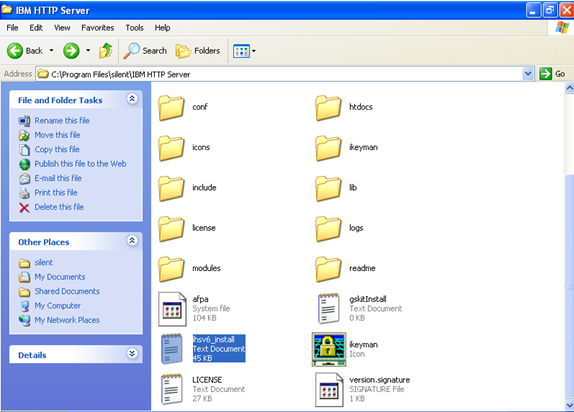
As per location mentioned in silent response file , check whether the server is being installed or not. In install folder, check for the following file “insv_install”.

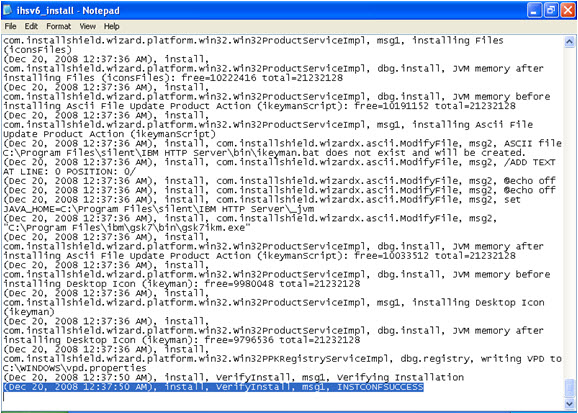
In the insv_install file, the following message should appear: (%DATE%), install, VerifyInstall, msg1, INSTCONFSUCCESS

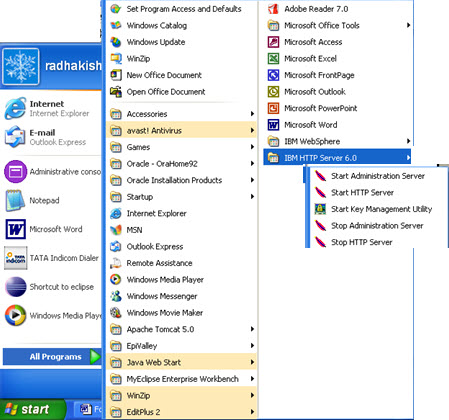
Also check in the program files whether the new entry of IBM http server is made.

Plugin Software Silent Installation

Go to the plugin folder, find the response file, and create your response file similarly.

For the location of the Application server, be careful while selecting the location. For example in the silent installation, I had used this following location of the server, so I am providing the same for the plugin software installation.

-W websphereLocationWizardBean.wasExistingLocation=”C:\Program Files\IBM\Silent\WebSphere\AppServer”

WAS MACHINE host name is the system name.

-P pluginSettings.wasMachineHostName=”rk”

Also check the port number that is being used here. I am using the same port number that I have used earlier for the silent installation of the server. The response file is as follows:

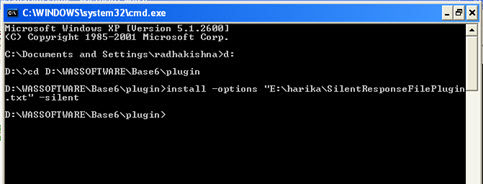
Go to the command prompt and go to the location of the software, and type the command as follows:

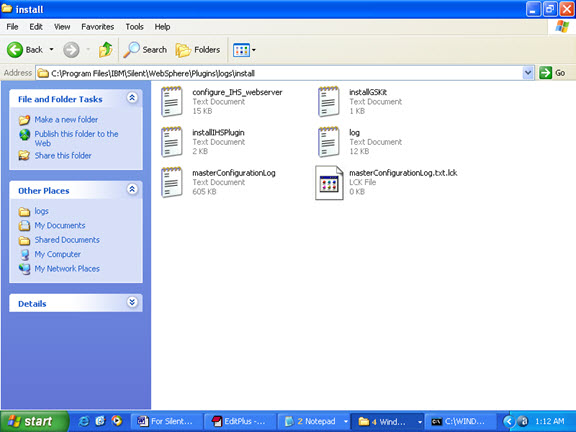
Correspondingly check at the location mentioned in the response file whether the plugin is being installed or not. Now go to the install folder in the specified location as follows:

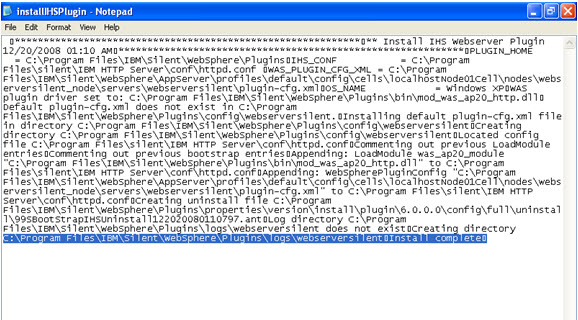
Check the text file install-HSPlugin. It must say the install complete.

Websphere : Federation of the WAS nodes

Posted by Sagar Patil

By federating nodes to the deployment manager we can administer all the application servers through one deployment manager console.

  1. You can add a new node through the admin console (explained below) &
  2. Using addNode command at command prompt

TO FEDERATE:

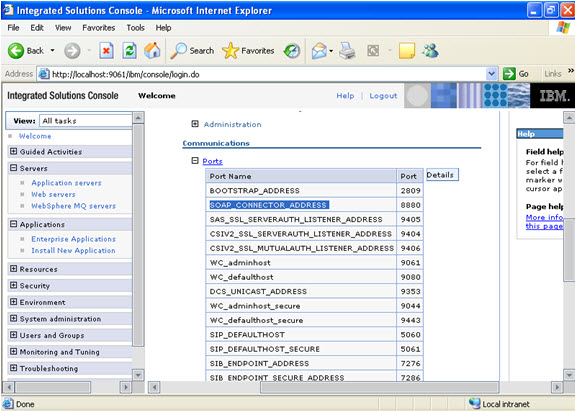
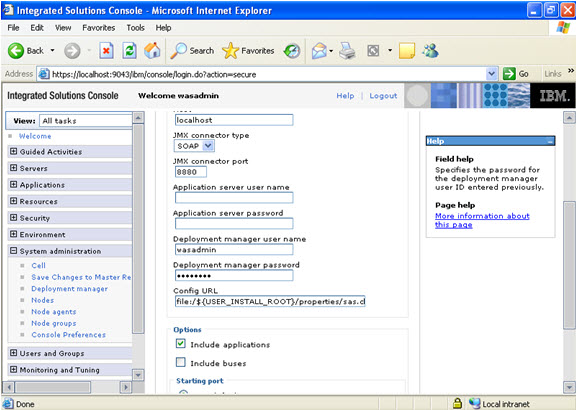
Log on to the admin console of the application server Go to servers -> Application Servers -> server -> ports And note the soap connector address (here 8880).

Communications between the node agent and deployment manager takes place through this port.

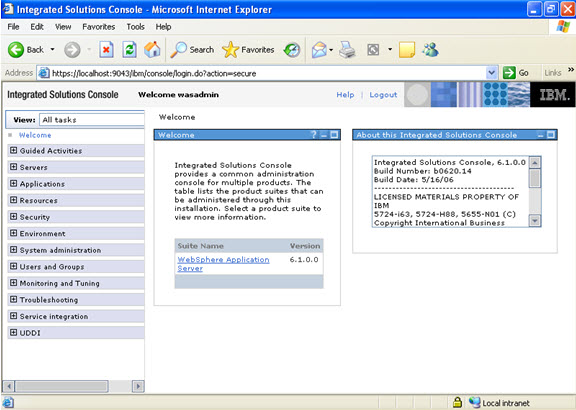
Log on to the WAS admin:

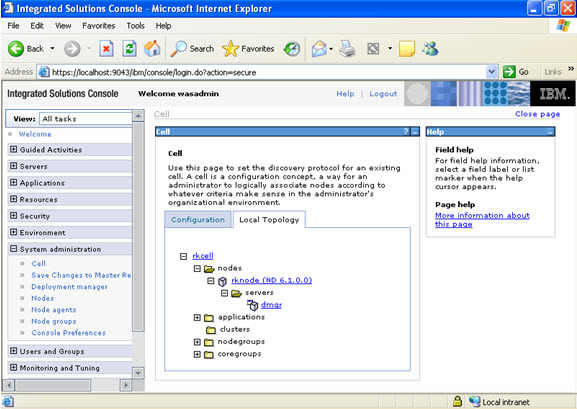
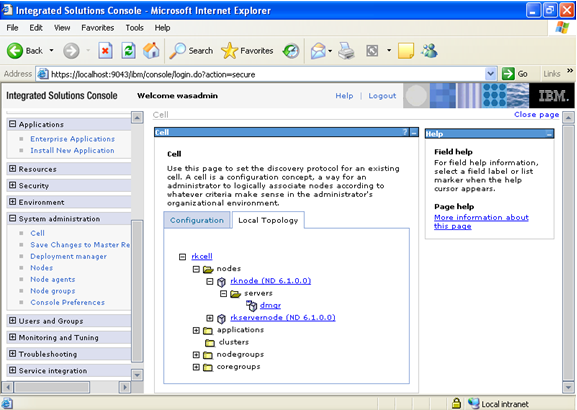
JUST FOR your information to check what is present in the cell, Go to admin console -> cell -> Local Topology

In the cell you will note that only dmgr is part of the cell as of now

[Before federation]

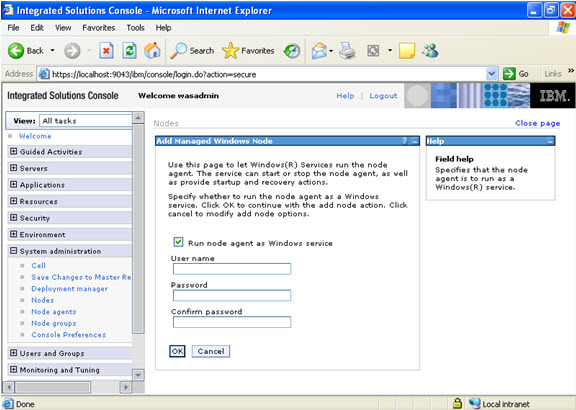
System administration -> nodes -> add node -> managed node

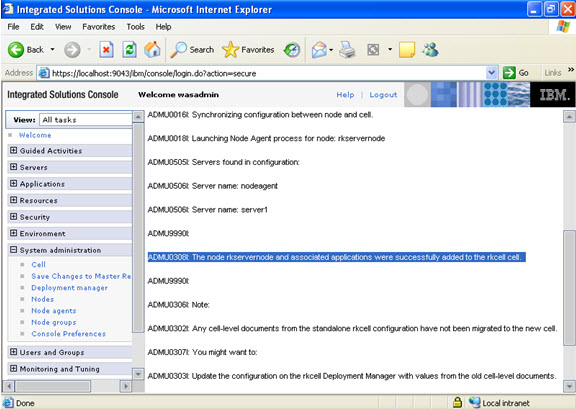
Check the message whether the node is successfully federated.

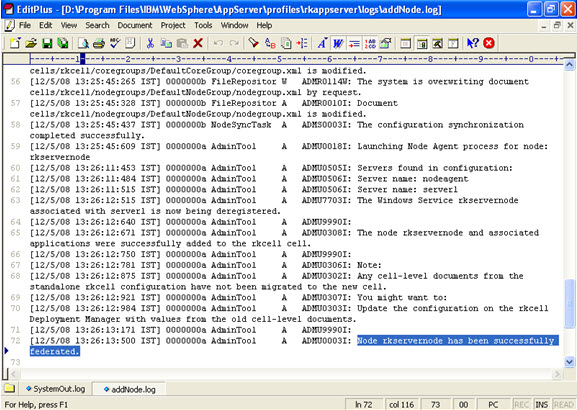
Now go to the appserver profile root/logs

And check the log file addNode.txt

See the message which the node federated successfully.

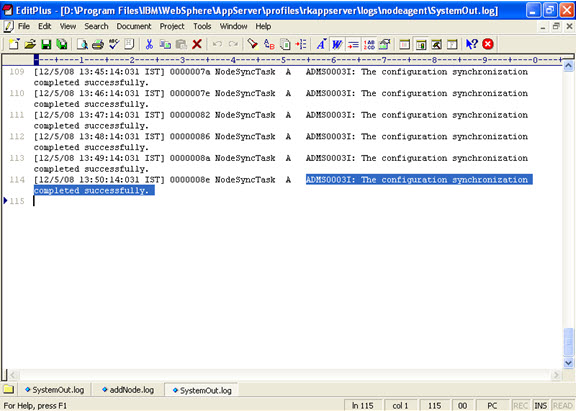
Go to application server profile root/logs/nodeagent/logs

And check for systemOut.log and the message.

The configuration synchronization completed successfully.

To verify federation from the admin console:

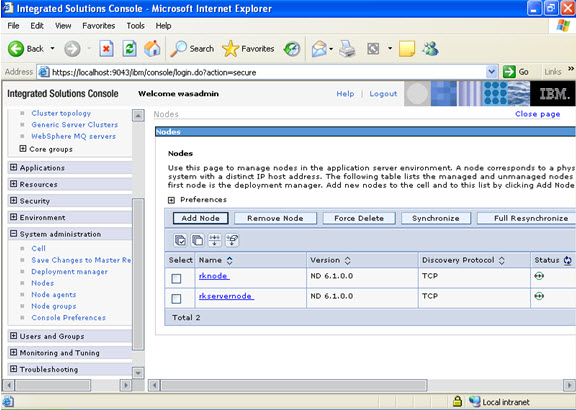
System administration -> nodes -> check the node whether it is synchronized.

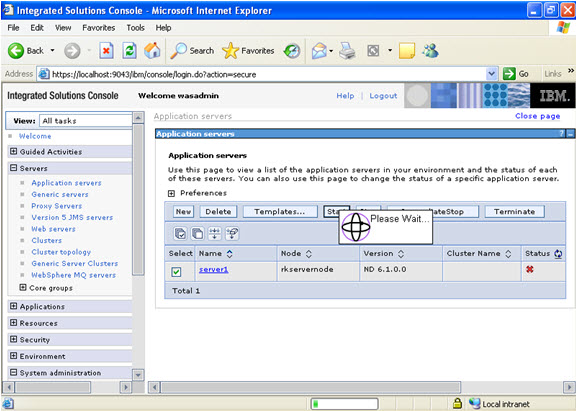
Start the application server.

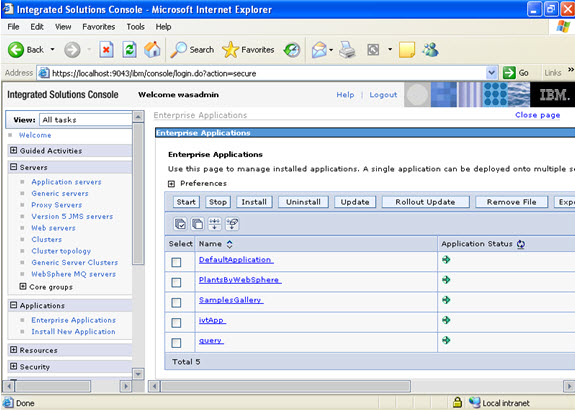
Check the applications if they are running.

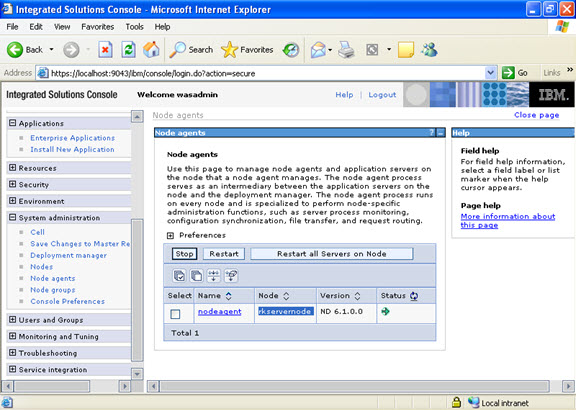
Go to node agents; Verify that a node agent process is created on the node you federated.

Now you can see the node added.

Note: Till now we have seen federating a node from deployment manager’s admin console. We can also federate a node from the command prompt of application server’s command prompt.


Websphere : Deploy an Application using GUI Deployment Manager (Dmgr)

Posted by Sagar Patil

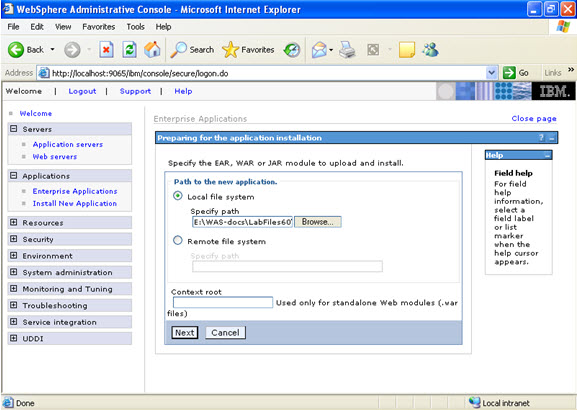
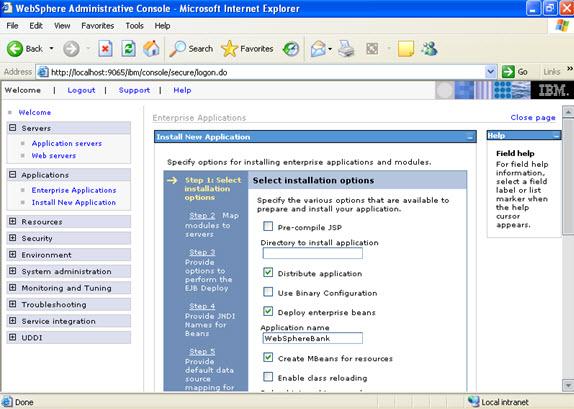
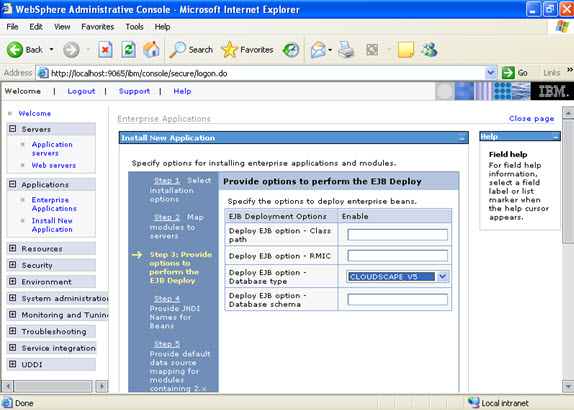
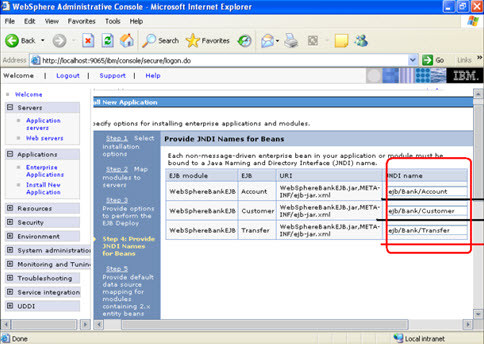
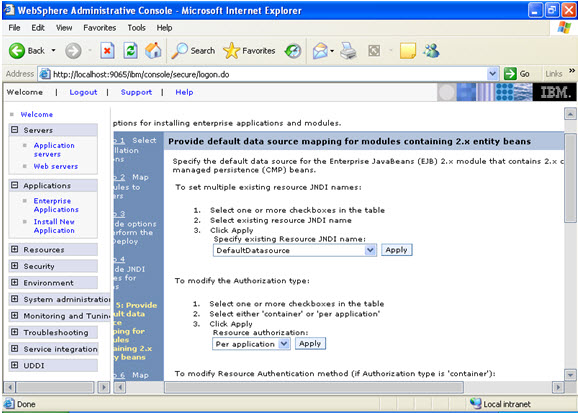
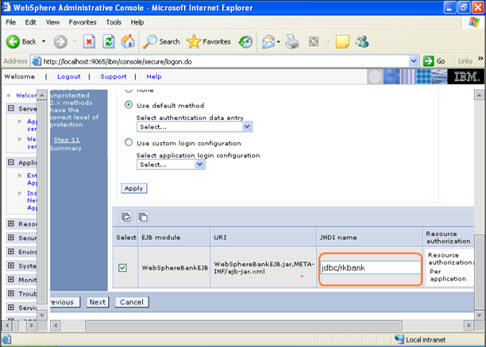
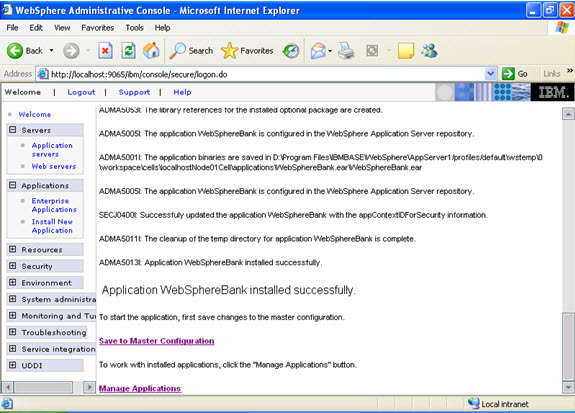
Go to console Enterprise Applications -> install -> location of the application

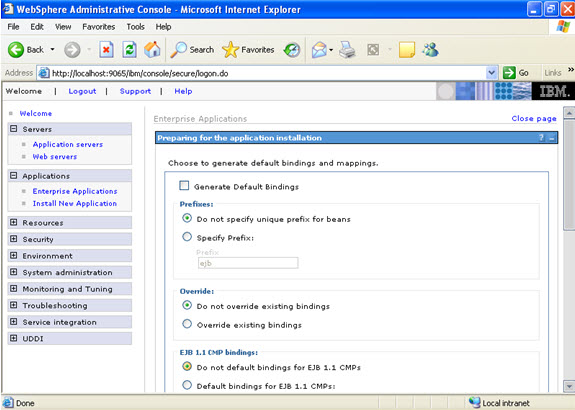
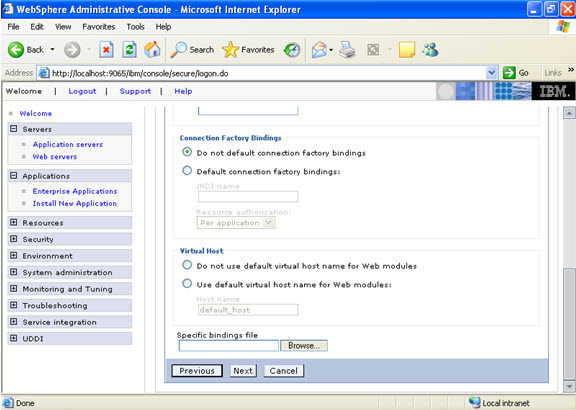
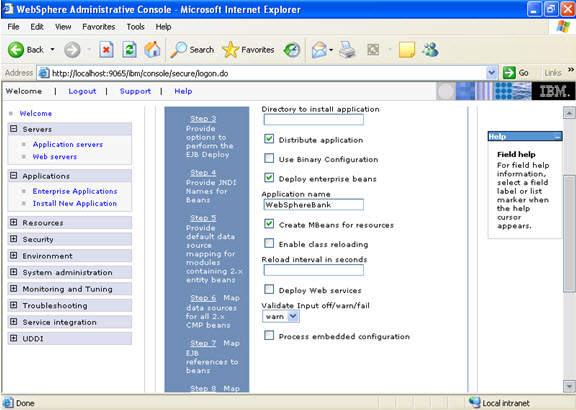
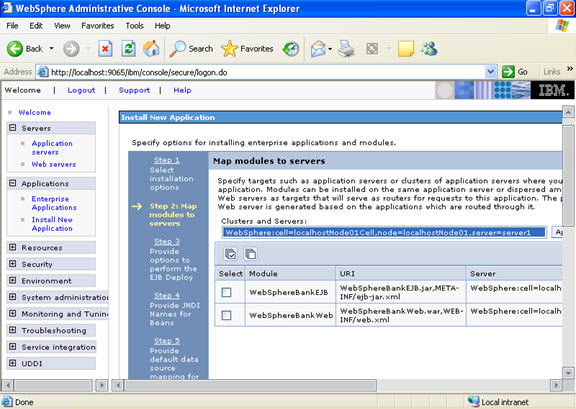
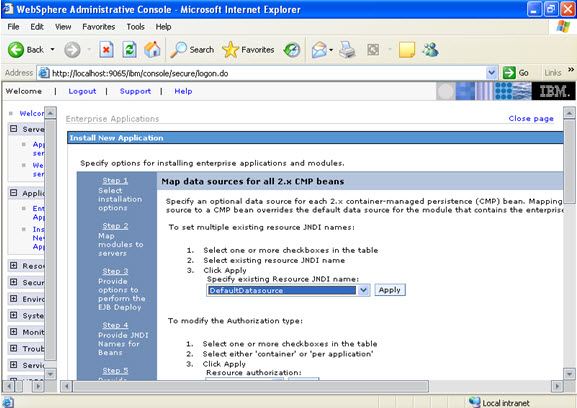
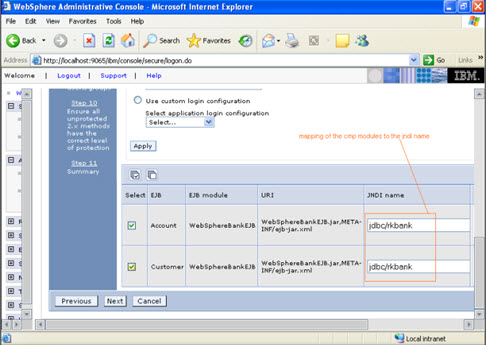
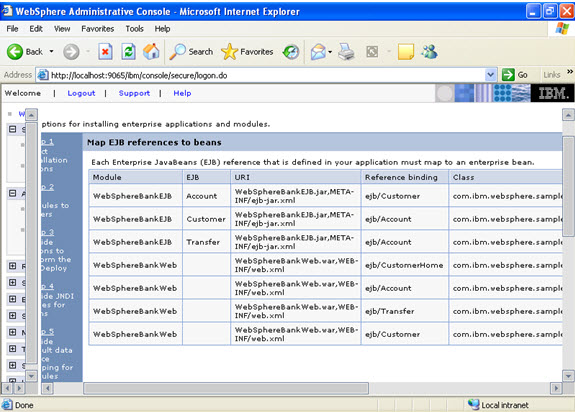
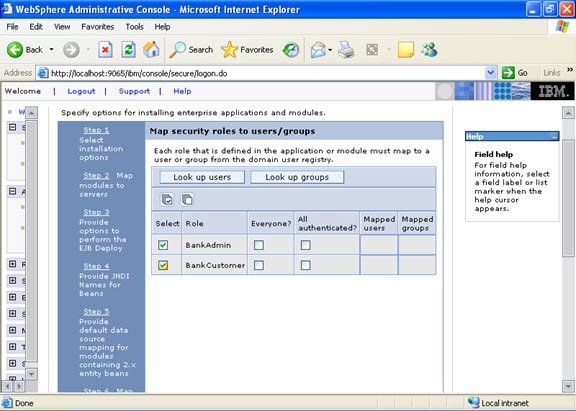
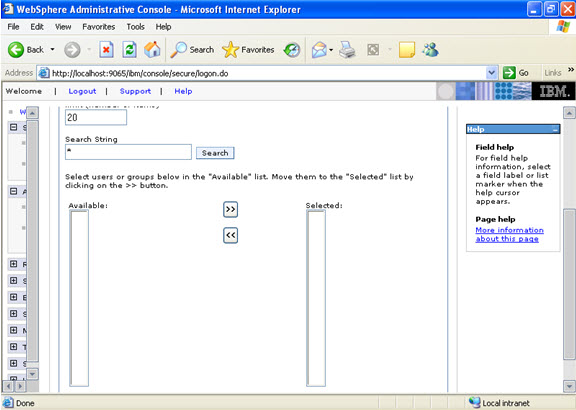
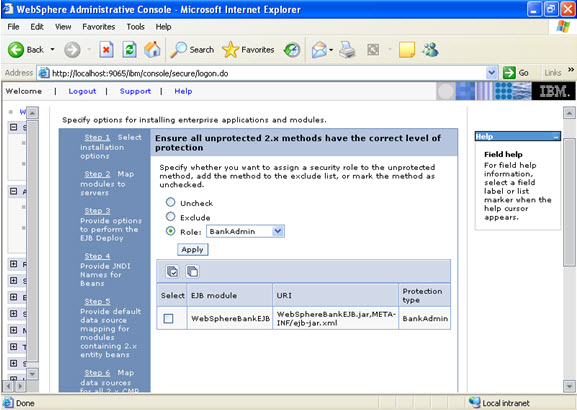
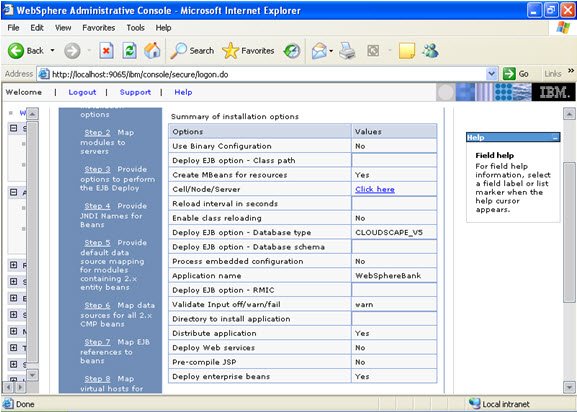
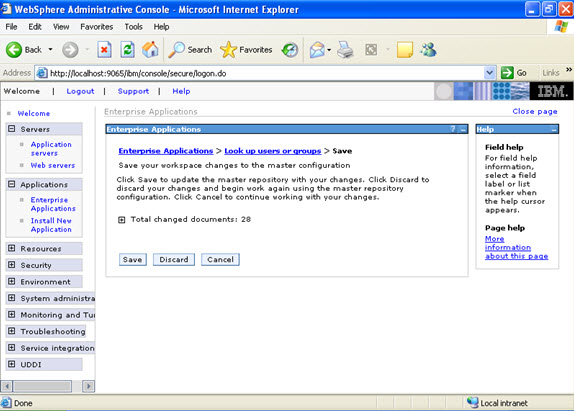
    Here, we are using the lab files (An J2ee Application) that are located in our system. Click on next. Click on next. NOW, select the modules and select the application servers where you want to install the particular application so that the corresponding modules are installed on that particular servers. Click on next Now select the database that you want to use. Step 4 Each none message driven bean in the application should be bound to the Java naming and directory interface. Step 5 In the step 5 same screen only, You are mapping the modules to the entity beans. Now you have to specify the jndi name STEP 6 In this step, you have to map the modules to the cmp beans. Step 7 Step 8 Step 9 Now there are two roles that were specified in the application. There is a tab to look up users. Now you can select the tab and loop up for the users and you can assign the particular users for that module. When you click on the tab for look up users: Here in my system there are no users, but it will show a list of users where you can select. I have selected every one in the previous screen. Step 10 Select the role. This is the summary of the settings that you have made. And click Finish.


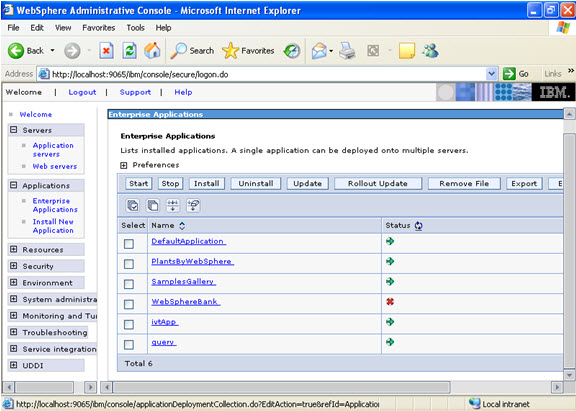
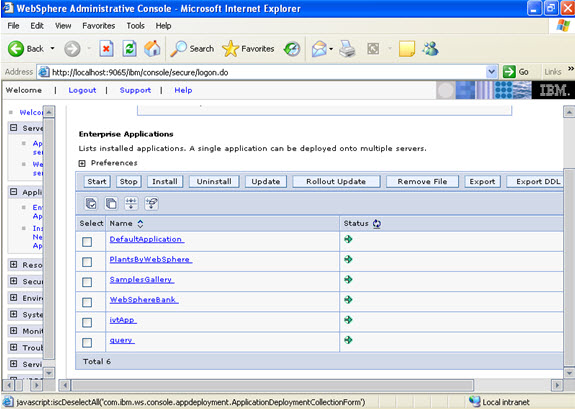
    Now select the application and start.


    For command prompt installation:


    Go to wsadmin. Now at wsadmin bin Wsadmin>bin Note: If you place the .war file at the bin, then it is OK. OR ELSE, you have to give the location of the war file. Wsadmin>bin>$AdminApp installInteractive webspherebank.ear And follow the suggestions as per your requirement. And after successful installation save by $AdminConfig save


    To configure the database


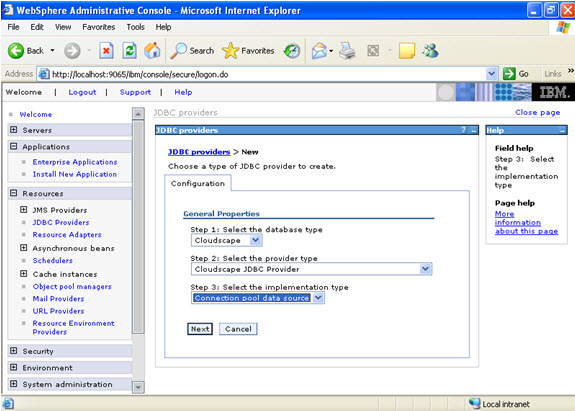
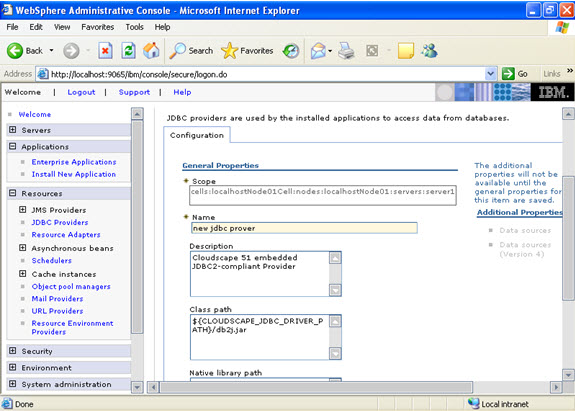
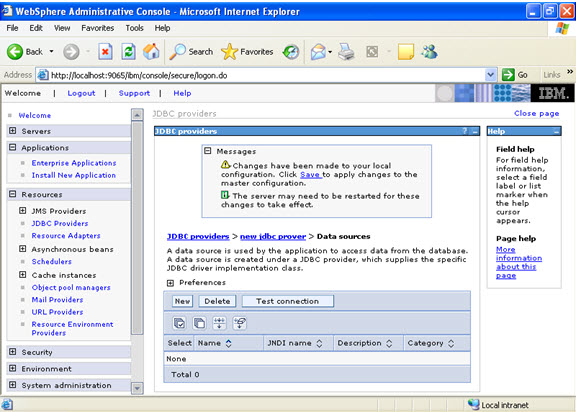
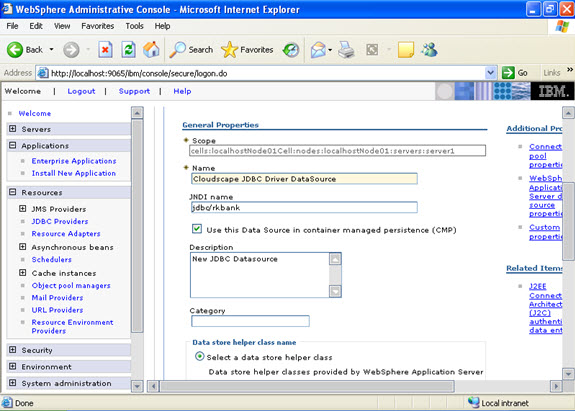
    Jdbc providers -> select serverscope Select new. And select as follows: Give the name: Select data sources -> new Click new, and provide the address of the database and name of the jndi.

    Websphere Application Server Security

    Posted by Sagar Patil

    Authentication – is the act of proving a certain user’s identity.
    Authorization – is a process of granting access or giving permission to a user to perform certain tasks.

    To perform these operations of Authentication and Authorization, Websphere needs ‘REGISTRY’.

    Websphere supports three kinds of registries.

    • Custom
    • Operating System
    • LDAP

    Custom
    A user provided class is used to implement the registry API

    Operating System
    User and group registry used by the host operating system.

    LDAP
    A registry that supports the Light Weight Directory Access Protocol.


    Custom registry :  1. Create a registry file in the appropriate location. Ex: c:\fileregistry\

    For users create: usersfile.registry

    For groups create: groupfile.registry

    To configure Websphere security on your WAS you have to perform 3 tasks.

    1. Configure user registry
    2. Configure LTPA [light weight third party authentication]
    3. Enable security.

    Note: LTPA is like a token, which passes between the browser request and the application server. It is used to provide an identity to the remote server, that the particular request is coming from a particular user.

    The following are screen shots from the base edition.

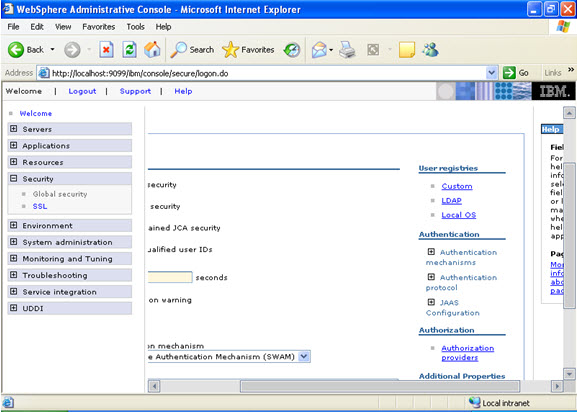
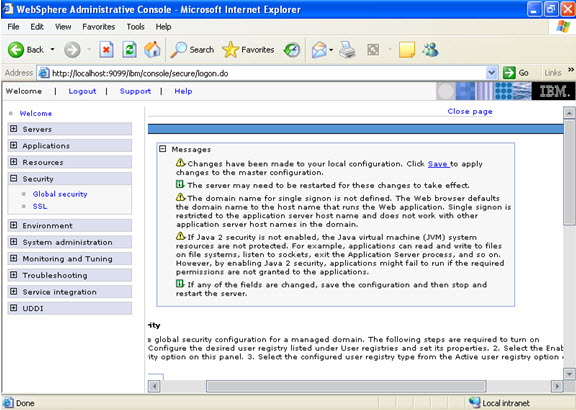
    Security -> Global security ->

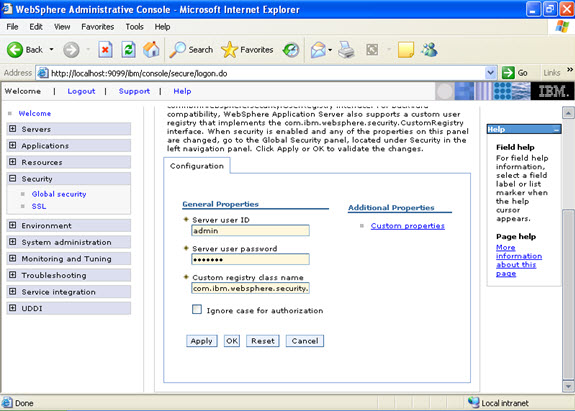
    In the user registries select custom registries; give the user id and password.

    Here I have given admin/admin

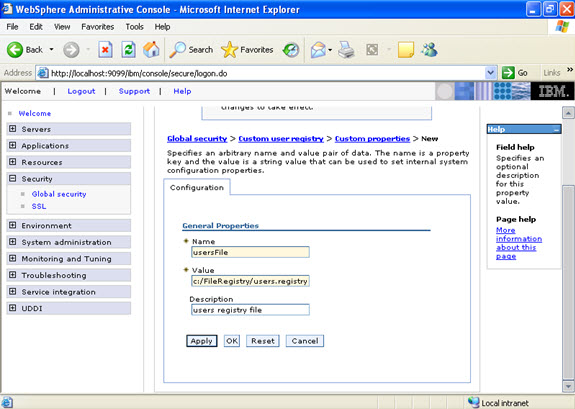
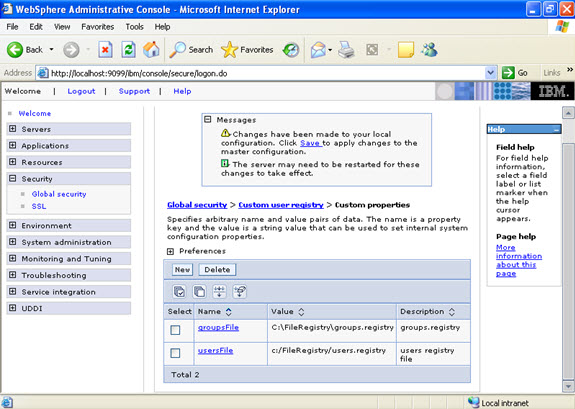
    Now click on custom properties, and give the location of the users.registry file, click apply and ok.

    Similarly add groups.registry.

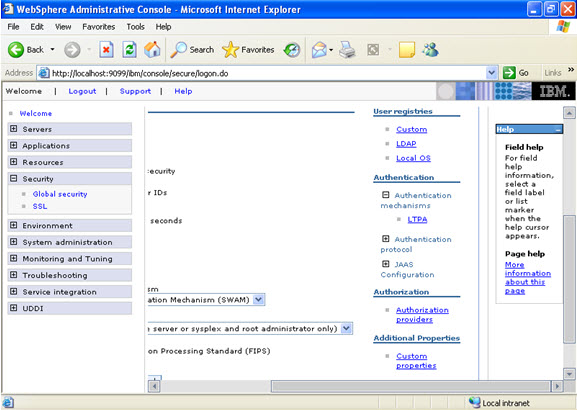
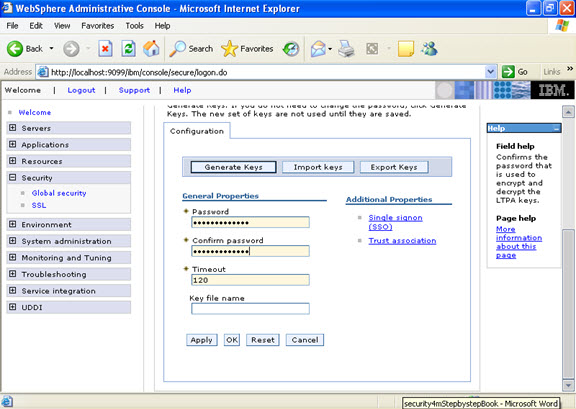
    To configure the LTPA authentication mechanism, go to console security -> global security -> Authentication Mechanism ->

    Here I have given administrator as the password.

    You should apply and save the changes.

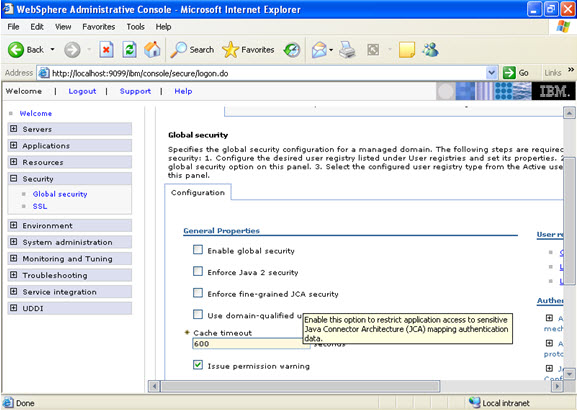
    Now you are ready to enable the global security.

    After saving it will lead to the console as follows:

    Select to enable global security, uncheck java 2 security.

    In the active protocol list there are two options:

    1. CSI
    2. CSI and SAS

    In the active protocol list select CSI (Common Secure Interoperability protocol).

    If you need back ward compatibility with the other versions of WAS select CSI and SAS.

    For active authentication mechanism select LTPA.

    For active user registry Select custom user registry and click apply.

    Click Apply, then OK.

    It’s OK if you received warnings.

    Log out.

    Stop the server.

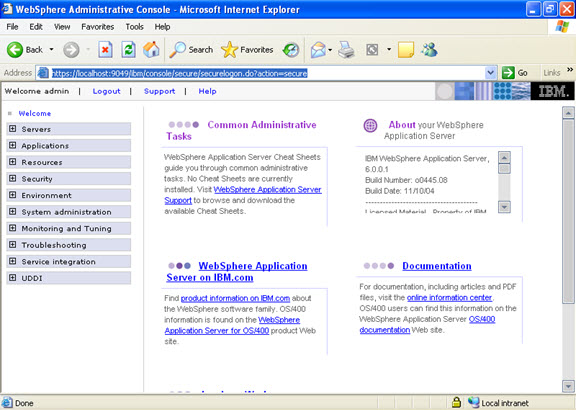
    then login again.

    On the address bar, you will observe that you were redirected to a secured Http: environment:

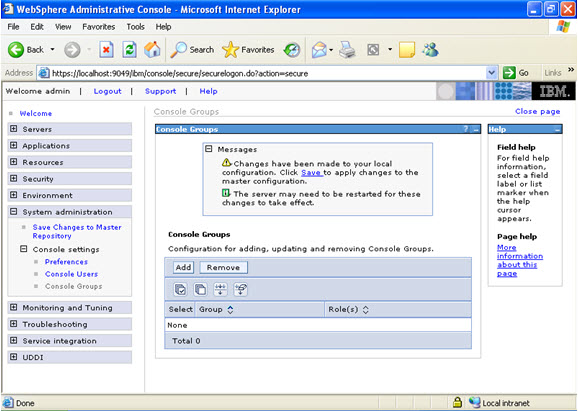
    To create a group of administrators who should login.

    Go to System Administration -> console -> console groups and add

    Websphere Clustering and Work Load Management

    Posted by Sagar Patil

    Work Load Management [WLM]: WLM means share the requests across multiple application servers.

    Important terms

    • Scalability
    • Load Balancing
    • High Availability
    • Failover

    WLM is implemented by using the clusters of application servers.

    Uses of WLM

    1. WLM provides fail over so that application availability is increased.
    2. WLM optimizes the distribution of requests.

    Logical grouping of applications is called a cluster.

    Instead of installing an application on an individual server, Install it on a cluster so that the application is automatically deployed on each application server which is a member of the cluster.

    Vertical cluster: when the cluster members are defined on the same machine.

    Horizontal cluster: when the cluster members are defined on different machines. Also, a combination of vertical and horizontal clusters can be made within the same machine.

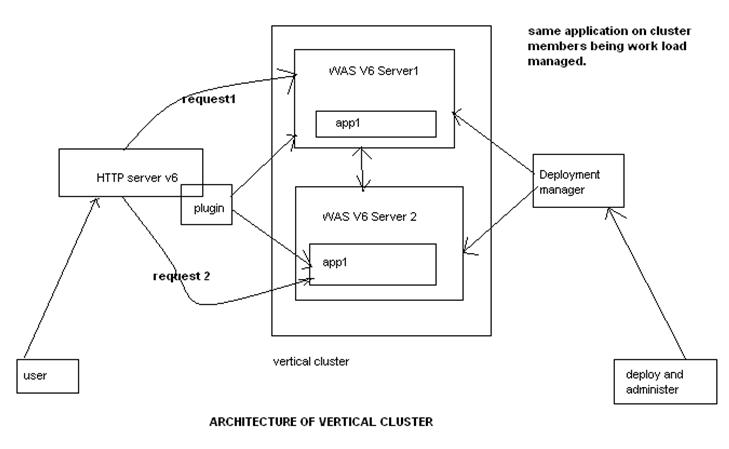
    Vertical cluster architecture:

    The application app1 is installed on the cluster. This application was installed on both the application servers automatically when we deploy the app1 on the cluster through the Deployment manager’s admin console.

    The deployment manager and http server can be in the same machine as the cluster member or in different machines.

    [For production it is recommended to be in different machines]

    We need to generate the plugin-cfg.xml file for the cluster environment.
    This file contains the necessary information to work load manage requests for the cluster members.

    It depends on the factors like …

    • HTTP session creation
    • Load balance weight value in plug-in file.

    Note: Cluster members will have only applications in common. Other attributes of the application servers in a cluster may differ.

    Websphere Application Server Logs

    Posted by Sagar Patil

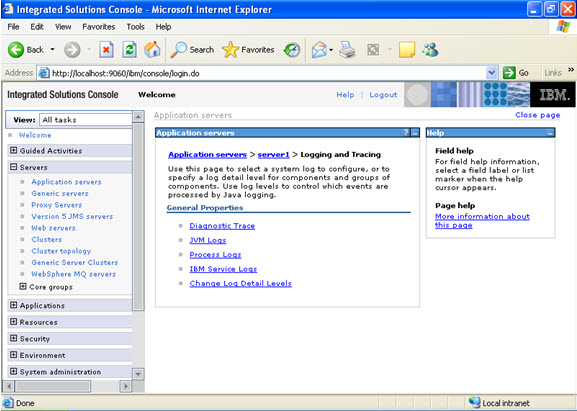
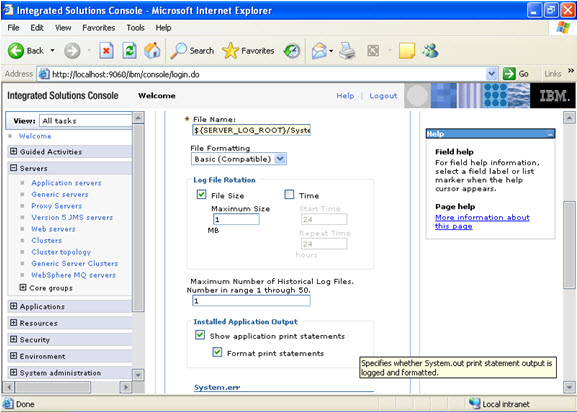
    JVM Logs:The JVM logs are created by redirecting the System.out and System.err streams of the JVM to independent log files. The System.out log is used to monitor the health of the running application server. The System.err log contains exception stack trace information that is used to perform problem analysis. One set of JVM logs exists for each application server and all of its applications. JVM logs are also created for the deployment manager and each node manager

      Application servers -> click on server -> Troubleshooting -> Logging and tracing -> jvmlogs

      • Log file Rotation tells about the size of the log file
      • Maximum no. of historical files tell how many log files can be maintained.

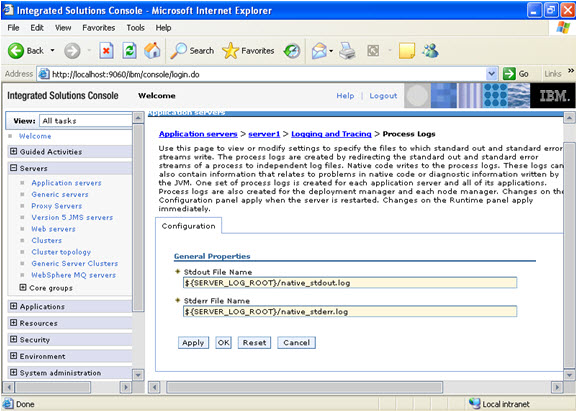
      Process Logs: The process logs are created by redirecting the standard out and standard error streams of a process to independent log files. Native code writes to the process logs. These logs can also contain information that relates to problems in native code or diagnostic information written by the JVM. One set of process logs is created for each application server and all of its applications. Process logs are also created for the deployment manager and each node manager.

      IBM Service Logs:The IBM service log contains both the application server messages that are written to the System.out stream and special messages that contain extended service information that you can use to analyze problems. One service log exists for all Java virtual machines (JVMs) on a node, including all application servers and their node agent, if present. A separate activity log is created for a deployment manager in its own logs directory. The IBM Service log is maintained in a binary format. Use the Log Analyzer or Showlog tool to view the IBM service log.

        Script to auto-start Websphere services on RHEL after a reboot

        Posted by Sagar Patil

        Red Hat Linux provides a standardized interface to allow users to add scripts to start various processes during system initialization without requiring a user to log in to the system. This process consists of three steps:

        1.  Create the start_server1 script.

        Navigate to /opt/WebSphere/AppServer/bin directory and run following command. This command generates a script named start_server1.sh which is referenced by the actual initialization script.

        ./startServer.sh server1 -script -background  [ Note here server1 is name of a JVM]

        2. Create the ibmhttpd and was scripts using the scripts below for reference and place them in the /etc/init.d directory. Make sure to set the executable flag in the scripts. The ibmhttpd script is the system initialization script that is used to automatically start the IBM HTTP Server at system initialization time. The was script is the system initialization script that is used to automatically start WebSphere Application Server .

        Example of ibmhttpd script:

        #!/bin/bash
        #
        # apache
        #
        # chkconfig: 345 85 15 — line says run this script in run level 5, with “start” at 85 and “stop” at 15 (so for startups, it’s done near the end of the startup process, and for shutdown, it’s done quite early
        # description: Start up the Apache web server.
        RETVAL=$?
        APACHE_HOME=”/opt/IBMHttpServer”
        case “$1″ in
        start)
        if [ -f $APACHE_HOME/bin/apachectl ]; then
        echo $”Starting IBM Http Server”
        $APACHE_HOME/bin/apachectl start
        fi
        ;;
        stop)
        if [ -f $APACHE_HOME/bin/apachectl ]; then
        echo $”Stopping IBM Http Server”
        $APACHE_HOME/bin/apachectl stop
        fi
        ;;
        status)
        if [ -f $APACHE_HOME/bin/apachectl ]; then
        echo $”Show status of IBM Http Server”
        $APACHE_HOME/bin/apachectl status
        fi
        ;;
        *)
        echo $”Usage: $0 {start|stop|status}”
        exit 1
        ;;
        esac
        exit $RETVAL

        Example of a was autostart script:

        #!/bin/bash
        #
        # apache
        #
        # chkconfig: 345 90 10
        # description: Start up the WebSphere Application Server.
        RETVAL=$?
        WAS_HOME=”/opt/IBM/WebSphere/AppServer/profiles/Profile01″

        case “$1″ in
        start)
        if [ -f $WAS_HOME/Node/bin/start_nodeagent.sh ]; then
        echo $”Starting IBM WebSphere Node Agent and Application Server”
        $WAS_HOME/dmgr/bin/startManager.sh
        $WAS_HOME/Node/bin/start_nodeagent.sh
        $WAS_HOME/Node/bin/start_server_member1.sh
        $WAS_HOME/Node/bin/start_server_member2.sh
        fi
        ;;
        stop)
        if [ -f $WAS_HOME/bin/stopServer.sh ]; then
        echo $”Stop IBM WebSphere Application Server”
        $WAS_HOME/Node/bin/stop_server_member1.sh
        $WAS_HOME/Node/bin/stop_server_member2.sh
        $WAS_HOME/Node/bin/stop_nodeagent.sh
        $WAS_HOME/dmgr/bin/stopManager.sh
        fi
        ;;
        status)
        if [ -f $WAS_HOME/bin/serverStatus.sh ]; then
        echo $”Show status of IBM WebSphere Application Server”
        $WAS_HOME/bin/serverStatus.sh server_member1
        $WAS_HOME/bin/serverStatus.sh server_member2
        $WAS_HOME/bin/serverStatus.sh nodeagent
        fi
        ;;
        *)
        echo $”Usage: $0 {start|stop|status}”
        exit 1
        ;;
        esac
        exit $RETVAL

        3. Establish the ibmhttpd and was scripts as services in order to run them in the system initialization process. To do this, enter the following commands as root user:

        chkconfig –add was
        chkconfig –level 5 was on
        chkconfig –add ibmhttpd
        chkconfig –level 5 ibmhttpd

        Please check service details using “chkconfig –list | grep httpd/was”

        The chkconfig –add commands add the script entries into the services table and the chkconfig –level commands indicate the runlevels at which Red Hat should automatically run the scripts.

        4. Test the autostart scripts by rebooting your system and verifying that the desired processes have started.

        Monitor/List Apache Active Connections : Websphere JVM Connections

        Posted by Sagar Patil

        1. If you configure Apache for mod_status you can view how many connections are open, the bandwidth being used, and a bunch of other neat statistics.

        Example  http://httpd.apache.org/server-status

        2. If you’re using Apache2, then apache-top would be useful as it’s interactive and would obviously update in real time:

        Example : http://www.fr3nd.net/projects/apache-top/

        3. To see number of IP connections and IPs connected to port 80, use the following command.

        $netstat -plan|grep :80|awk {‘print $5’}|cut -d: -f 1|sort|uniq -c|sort -nk 1

        $ netstat -plan|grep :80 | wc -l  (Number of connections on http port 80)
        17

        $ netstat -plan|grep :9080 | wc -l  (Number of connections on JVM port 9080)
        10

        Same command could be used to locate connections on any TCP port

        What is Oracle OPatch, How to use OPatch & List patches

        Posted by Sagar Patil

        Patch is an Oracle supplied utility to assist you with the process of applying interim patches to Oracle’s software. OPatch is a Java-based utility which requires the Oracle Universal Installer to be installed. It is platform independent and runs on all supported operating systems.

        OPatch supports the following:
        * Applying an interim patch.
        * Rolling back the application of an interim patch.
        * Detecting conflict when applying an interim patch after previous interim patches have been applied. It also suggests the best options to resolve a conflict.
        * Reporting on installed products and interim patch.

        Prior to release 10.2 (OPatch for 10.2 is only compatible with 10.2 and nothing earlier), OPatch was available from MetaLink as a patch in and of itself (p2617419_10102_GENERIC.zip for release 10.1.0.2). With 10.2, OPatch is installed as part of the RDBMS software.

        Opatch has several options to execute it:
        * “lsinventory” = Adding the lsinventory option to opatch produces a report saying the patches that were applied
        * “-report” = Will report to screen and will NOT apply the real patch. Using “-report” is a good way of performing nondestructive testing of the patch installation process.
        * “rollback”= Will undo the patch that was applied. Example: opatch rollback –id 4667809

        Applying a patch is simple as:
        * opatch lsinventory    -> To see he list of patches already installed
        * opatch apply <patchid>     –> To REALLY aplply the patch

        Example Applying Patch 4751921

        After the Patch is Installed:
        1.Log in as sys as sysdba.
        2. cd $ORACLE_HOME/rdbms/admin
        3. spool catpatch_database_name
        4. shutdown immediate
        5. startup migrate
        6. @catpatch.sql   ( this takes at least 1 hour ). After catpatch completed,
        7. select object_name,owner from dba_objects where ststus=’INVALID’;
        ( YOU WILL GET BETWEEN 230-3300 INVALID OBJECTS , DON’T PANIC )
        8. @utlrp.sql
        9.select object_name,owner from dba_objects where ststus=’INVALID’;   ( YOU WILL GET near 0 invalid objects )
        10. shutdown immediate;
        11. startup


        Listing Patches

        All patches that are installed with Oracle’s OPatch Utility (Oracle’s Interim Patch Installer) can be listed by invoking the opatch command with the lsinventory option. Here is an example:

        $ cd $ORACLE_HOME/OPatch
        $ opatch lsinventory
        Invoking OPatch 10.2.0.1.0
        Oracle interim Patch Installer version 10.2.0.1.0
        Copyright (c) 2005, Oracle Corporation.  All rights reserved..

        Installed Top-level Products (1):
        Oracle Database 10g                                           10.2.0.1.0
        There are 1 products installed in this Oracle Home.
        There are no Interim patches installed in this Oracle Home.
        OPatch succeeded.

        Another Method using SYS.REGISTRY$HISTORY Table

        Since January 2006, contains 1 row for most recent CPU patch applied. A method for determining if CPU patch is applied

        SELECT comments, action_time, id “PATCH_NUMBER”, version FROM sys.registry$history WHERE action = ‘CPU’;

        COMMENTS ACTION_TIME PATCH_NUMBER VERSION
        view recompilation 42:39.2 6452863
        view recompilation 59:20.3 6452863
        view recompilation 23:58.7 6452863

        SELECT comments, action_time, id “PATCH_NUMBER”, version FROM sys.registry$history

        COMMENTS ACTION_TIME PATCH_NUMBER VERSION
        Upgraded from 10.2.0.1.0 40:28.8 10.2.0.4.0
        CPUApr2009 46:06.0 4 10.2.0.4
        view recompilation 42:39.2 6452863
        CPUOct2009 56:35.7 6 10.2.0.4
        view recompilation 59:20.3 6452863
        CPUJan2010 01:47.4 6 10.2.0.4
        view recompilation 23:58.7 6452863

        One other useful Opatch feature

        Along with the log and inventory files, Opatch output includes a history file, which contains date and action performed information. The history file is named opatch_history.txt and is located in the $OH\cfgtools\opatch directory. As an example of its contents, the “rollback –help” action performed earlier was recorded as:

        [oracle@ opatch]$ pwd
        /u01/app/oracle/product/10.2.0/cfgtoollogs/opatch
        [oracle@opatch]$ ls -lrt
        -rw-r–r– 1 oracle oracle  98608 May 29  2009 opatch2009-05-29_11-37-50AM.log
        -rw-r–r– 1 oracle oracle 103814 Dec 14  2009 opatch2009-12-14_20-49-31PM.log
        -rw-r–r– 1 oracle oracle   5838 Mar 11  2010 opatch2010-03-11_16-01-00PM.log
        -rw-r–r– 1 oracle oracle  33878 Mar 29  2010 opatch2010-03-29_19-53-07PM.log

        vi opatch2010-03-29_19-53-07PM.log

        Applying patch 9173244…
        INFO:Starting Apply Session at Mon Mar 29 19:53:42 BST 2010
        INFO:ApplySession applying interim patch ‘9173244’ to OH ‘/u01/app/oracle/product/10.2.0’
        INFO:Starting to apply patch to local system at Mon Mar 29 19:53:42 BST 2010
        INFO:Start the Apply initScript at Mon Mar 29 19:53:42 BST 2010
        INFO:Finish the Apply initScript at Mon Mar 29 19:53:42 BST 2010
        INFO:OPatch detected ARU_ID/Platform_ID as 226
        INFO:Start saving patch at Mon Mar 29 19:53:44 BST 2010

        Backup Websphere Configuration using backupconfig.sh

        Posted by Sagar Patil

        backupConfig.sh will create backup of your websphere configuration while restoeConfig.sh could be used to restore backup taken by backupConfig.sh.

        $WAS_HOME/dmgr/bin/backupConfig.sh $HOME/websphere_backup.zip -nostop -logfile $HOME/backupConfig.lst

        Parameters

        The following options are available for the backupConfig command:

        -nostop
        Tells the backupConfig command not to stop the servers before backing up the configuration
        -quiet
        Suppresses the progress information that the backupConfig command prints in normal mode
        -logfile file_name
        Specifies the location of the log file to which trace information is writtenBy default, the log file is named backupConfig.log and is created in the logs directory
        -profileName profile_name
        Defines the profile of the application server process in a multi-profile installationThe -profileName option is not required for running in a single-profile environment. The default for this option is the default profile.
        -replacelog
        Replaces the log file instead of appending to the current log
        -trace
        Generates trace information into the log file for debugging purposes
        -username user_name
        Specifies the user name for authentication if security is enabled in the server; acts the same as the -user option
        -user user_name
        Specifies the user name for authentication if security is enabled in the server; acts the same as the -username option
        -password password
        Specifies the password for authentication if security is enabled in the server
        -help
        Prints a usage statement
        -?
        Prints a usage statement
        [was61@Server1 bin]$ ./restoreConfig.sh
        Usage: restoreConfig backup_file [-location restore_location] [-quiet]
        [-nostop] [-nowait] [-logfile <filename>] [-replacelog] [-trace]
        [-username <username>] [-password <password>] [-profileName
        <profile>] [-help]
        [was61@Server1 bin]$ pwd
        /opt/IBM/WebSphere/AppServer/profiles/Profile01/dmgr/bin
        [was61@Server1 bin]$ ./restoreConfig.sh /opt/IBM/WebSphere/AppServer/profiles/Profile01/dmgr/bin/backupconfig_03Aug2010_beforeSslChange.zip
        ADMU0116I: Tool information is being logged in file
        /opt/IBM/WebSphere/AppServer/profiles/Profile01/dmgr/logs/restoreConfig.log
        ADMU0128I: Starting tool with the dmgr profile
        ADMU0505I: Servers found in configuration:
        ADMU0506I: Server name: dmgr
        ADMU2010I: Stopping all server processes for node Server1_Manager
        ADMU0512I: Server dmgr cannot be reached. It appears to be stopped.
        ADMU5502I: The directory
        /opt/IBM/WebSphere/AppServer/profiles/Profile01/dmgr/config already
        exists; renaming to
        /opt/IBM/WebSphere/AppServer/profiles/Profile01/dmgr/config.old
        ADMU5504I: Restore location successfully renamed
        ADMU5505I: Restoring file
        /opt/IBM/WebSphere/AppServer/profiles/Profile01/dmgr/bin/backupconfig_03Aug2010_beforeSslChange.zip
        to location
        /opt/IBM/WebSphere/AppServer/profiles/Profile01/dmgr/config
        ………………………………………………………………………………………………………………………………………………………………………………………………………………………………………………………………………………………………………………………………………………………………………………………………………………………………………………………………………………………………………………..ADMU5506I: 560 files successfully restored
        ADMU6001I: Begin App Preparation –
        ADMU6009I: Processing complete.

        Archivelogs deleted, Unavailable archive files during rman backup

        Posted by Sagar Patil

        I carried a big data upload and as a result of it my archive volume filled up in no time. As matter of urgency I started moving archive logs without backup to another destination. The next thing to go wrong was my nightly backup.

        current log archived
        allocated channel: ORA_DISK_1
        channel ORA_DISK_1: sid=141 devtype=DISK
        RMAN-00571: ===========================================================
        RMAN-00569: =============== ERROR MESSAGE STACK FOLLOWS ===============
        RMAN-00571: ===========================================================
        RMAN-03002: failure of backup plus archivelog command at 03/10/2010 12:00:01
        RMAN-06059: expected archived log not found, lost of archived log compromises recoverability
        ORA-19625: error identifying file /u06/oradata/sit/prod/1_38525_700413864.arc
        ORA-27037: unable to obtain file status
        Linux-x86_64 Error: 2: No such file or directory
        Additional information: 3

        Run rman>crosscheck archivelog all;

        archive log filename=/u06/oradata/prod/arch/1_39458_700413864.arc recid=57937 stamp=713233333
        validation succeeded for archived log
        archive log filename=/u06/oradata/prod/arch/1_39459_700413864.arc recid=57938 stamp=713275039
        validation succeeded for archived log
        archive log filename=/u06/oradata/prod/arch/1_39460_700413864.arc recid=57939 stamp=713275200
        Crosschecked 936 objects

        Fired backup again and it was OK.

        Compare and Display difference between 2 Files

        Posted by Sagar Patil

        Comparing Files is one of very common task as a DBA, System Administrator. There are tonnes of Oracle,Websphere,linux configuration files. Often I have to compare one server to another and locate changes between environments.

        Recently one of my websphere server broke down. Despite my good efforts I couldn’t revive it so I had to restore it from a backup.  Then came the task to compare the websphere confiuration between good and bad. When I looked at $WAS_HOME/bin/backupconfig , it backed up more than 400 files and carrying one to one comparison is no way possible.  I used following script to locate the difference.

        #!/usr/bin/perl
        # file_compare.pl
        # Purpose: compare two files and show differences
        # usage: file_compare.pl filename1 filename2

        use strict;
        use warnings;

        my $file1 = shift or die “filename missing \n”;
        my $file2 = shift or die “filename missing \n”;

        open (FILE1, “< $file1”) or die “Can not read file $file1: $! \n”;
        my @file1_contents = <FILE1>; # read entire contents of file
        close (FILE1);

        open (FILE2, “< $file2”) or die “Can not read file $file2: $! \n”;
        my @file2_contents = <FILE2>; # read entire contents of file
        close (FILE2);

        my $length1 = $#file1_contents; # number of lines in first file
        my $length2 = $#file2_contents; # number of lines in second file

        if ($length1 > $length2) {
        # first file contains more lines than second file
        my $counter2 = 0;
        foreach my $line_file1 (@file1_contents) {
        chomp ($line_file1);

        if (defined ($file2_contents[$counter2])) {
        # line exists in second file
        chomp (my $line_file2 = $file2_contents[$counter2]);

        if ($line_file1 ne $line_file2) {
        print “\nline ” . ($counter2 + 1) . ” \n”;
        print “< $line_file1 \n” if ($line_file1 ne “”);
        print “— \n”;
        print “> $line_file2 \n\n” if ($line_file2 ne “”);
        }
        }
        else {
        # there is no line in second file
        print “\nline ” . ($counter2 + 1) . ” \n”;
        print “< $line_file1 \n” if ($line_file1 ne “”);
        print “— \n”;
        print “> \n”; # this line does not exist in file2
        }
        $counter2++; # point to the next line in file2
        }
        }
        else {
        # second file contains more lines than first file
        # or both have equal number of lines
        my $counter1 = 0;
        foreach my $line_file2 (@file2_contents) {
        chomp ($line_file2);

        if (defined ($file1_contents[$counter1])) {
        # line exists in first file
        chomp (my $line_file1 = $file1_contents[$counter1]);

        if ($line_file1 ne $line_file2) {
        print “\nline ” . ($counter1 + 1) . ” \n”;
        print “< $line_file1 \n” if ($line_file1 ne “”);
        print “— \n”;
        print “> $line_file2 \n” if ($line_file2 ne “”);
        }
        }
        else {
        # there is no line in first file
        print “\nline ” . ($counter1 + 1) . ” \n”;
        print “< \n”; # this line does not exist in file1
        print “— \n”;
        print “> $line_file2 \n” if ($line_file2 ne “”);
        }
        $counter1++; # point to next line in file1
        }
        }

        Output

        $perl compare_files.pl notworking.lst working.lst  | more

        line 1
        < 4     notworking/Cell/pmirm.xml

        > 4     working/Cell/pmirm.xml
        line 2
        < 4     notworking/Cell/resources-pme.xml

        > 4     working/Cell/resources-pme.xml
        line 3
        < 32    notworking/Cell/resources.xml

        > 32    working/Cell/resources.xml

        WebSphere : Synchronize Cluster Configuration with Dmgr & Nodes

        Posted by Sagar Patil

        In a Network Deployment environment, the deployment manager maintains the master repository for all of the WebSphere Application Server nodes and servers that it manages in the cell. Copies of the files that each node needs are replicated to that node by a process known as synchronization.

        In a Network Deployment environment with two nodes,  All of the configuration files relevant to both Node01 and Node02 are kept in the master repository along with the  configuration files that are relevant to the deployment manager. Only those files that are relevant to Node01 are replicated to Node01, and only those files that are relevant to Node02 are replicated to Node02. Each node gets a copy of the serverindex.xml file for every other node because this contains connection information for the other nodes, that is host names and ports.

        We  can set each node agent to perform automatic or manual synchronization and the interval at which each node agent will perform the synchronization. To set this in the administrative console,

        select System administration → Node agents → nodeagent → File synchronization service.

        We can manually initiate synchronization using the administrative console by selecting

        System administration → Nodes, putting a check by the node that you wish to synchronize, and then clicking either Synchronize or Full Resynchronize.

        You can also perform synchronization from the node agent using the syncNode.bat|sh script. You must stop the node agent to use this tool.

        Websphere JVM hang issue : How to create heap or thread dump

        Posted by Sagar Patil

        You should check if application server process is running to determine a crash. To do this, you need to know process ID of application server. You can find process ID at server name.pid file in:

        <WAS_install_root>/profiles/<profile>/logs/<server> For Exa : /opt/IBM/WebSphere/AppServer/profiles/Profile01/dmgr/logs/dmgr/dmgr.pid

        Open the <server_name>.pid file in a text editor. The four-digit number is a process ID. You can use appropriate operating system command to check if process is actively running. If it’s not running, then you have a crash.

        What is a Thread Dump? (Java Core Dumps) javacore.<PID><TIME>.txt

        A thread dump is a dump of the stacks of all live threads. Thus useful for analysing what an app is up to at some point in time, and if done at intervals handy in diagnosing some kinds of ‘execution’ problems (e.g. thread deadlock).

        When to generate ? : If you get unexplained server hangs under WebSphere, you can obtain, from the WebSphere server, a thread dump to help diagnose the problem.
        In the case of a server hang, you can force an application to create a thread dump.

        If an application server spontaneously dies, look for a file. The JVM creates the file in the product directory structure, with a name like javacore[number].txt

        What is a heap dump? heapdump.<PID><TIME>.phd

        A heap dump is a “binary dump” of the full memory the JVM is using, and is for example useful if you need to know why you are running out of memory – in the heap dump you could for example see that you have one billion User objects, even though you should only have a thousand, which points to a memory retention problem.

        When to generate? : Memory leaks in the Java heap produce java.lang.OutOfMemoryError exceptions in log files. However, not all out-of-memory errors are caused by Java heap memory leaks. Out-of-memory errors can also be caused by the following conditions:
        Java heap fragmentation. This fragmentation occurs when no contiguous chunk of free Java heap space is available from which to allocate Java objects. Various causes for this problem exist, including the presence of pinned or dosed objects or because of the repeated allocation of large objects.
        Memory leaks in native heap. This problem occurs when a native component, like DB2 connections, is leaking.

        How to create Thread Dumps (Java Core Dumps)/Heap Dumps using wsadmin.sh

        1. Navigate to cd <WAS_ROOT>/profiles/<PROFILE_NAME>/bin/

        2. Connect to deployment manager using wsadmin script
        wsadmin.sh <DMGR_HOST> <PORT> -conntype SOAP -username <USERNAME> -password <PASSWORD>

        3. Set object variable
        wsadmin> set jvm [$AdminControl completeObjectName type=JVM,process=<JVM_NAME>,node=<NODE_NAME>,*]

        4. Create HeapDump:

        wsadmin>$AdminControl invoke $jvm generateHeapDump
        /opt/IBM/WebSphere/AppServer/profiles/Profile01/Node01/./heapdump.20100202.121506.27816.0001.phd

        5. Create ThreadDump:

        wsadmin>set jvm [$AdminControl completeObjectName type=JVM,process=member2,*]

        wsadmin>$AdminControl invoke $jvm dumpThreads

        6. Heap or thread dump will be saved to <WAS_ROOT>/profiles/<PROFILE_NAME>/ directory with with respective naming convention

        Create Thread dumps using “kill -3” command

        Add following settings:
        Navigated to: Servers > Application Servers > Server1 (or the name of  the server to get a heap dump) > Process Definition > Environment Entries

        Then set following properties:
        IBM_HEAPDUMP = true
        IBM_HEAP_DUMP = true
        IBM_JAVA_HEAPDUMP_TEXT=true
        IBM_HEAPDUMP_OUTOFMEMORY=false
        JAVA_DUMP_OPTS=ONANYSIGNAL(JAVADUMP[5],HEAPDUMP[5])

        Here export JAVA_DUMP_OPTS=”ONANYSIGNAL(JAVADUMP[n],HEAPDUMP[m])”
        – n is the maximum number of javacores that can be generated, and
        – m is the maximum number of heapdumps that can be generated

        export JAVA_DUMP_OPTS=”ONANYSIGNAL(JAVADUMP[5],HEAPDUMP[5])”
        A kill -3 to the java process will generate a maximum of 5 javacore and 5 heapdump files.

        Now using “kill -3 <AppServer PID>” should create a HeapDump & ThreadDump


        Websphere First Failure Data Capture (FFDC) Logs

        Posted by Sagar Patil

        Often the websphere default systmout,systemerror logs doesn’t provide detailed information on error. In such cases have a look at directory logs under /opt/IBM/WebSphere/AppServer/profiles/Profile01/dmgr/logs/ffdc & /opt/IBM/WebSphere/AppServer/profiles/Profile01/Node/logs/ffdc

        There are three property files which control the behavior of the ffdc filter. The files which are used are based upon the state of the server:
        1. ffdcStart.properties: used during start of the server
        2. ffdcRun.properties: used after the server is ready
        3. ffdcStop.properties: used while the server is in the process of stopping

        [was61@IBM]$ du -a | grep ffdcRun.properties
        ./WebSphere/AppServer/properties/ffdcRun.properties

        #————————————————————————–
        # Enable FFDC processing
        #       FFDC=true [default]
        #       FFDC=false
        #————————————————————————–
        FFDC=true
        #————————————————————————–
        # Level of processing to perform
        #       0 – none
        #       1 – monitor exception path
        #       2 – dump the call stack, with no advanced processing
        #       3 – 2, plus object interspecting the current object
        #       4 – 2, plus use DM to process the current object
        #       5 – 4, plus process the top part of the call stack with DMs
        #       6 – perform advanced processing the entire call stack
        #————————————————————————–
        Level=4
        #————————————————————————–
        # ExceptionFileMaximumAge, number of days to purge the file
        #       ExceptionFileMaximumAge=<any positive number of days>
        #                Default is 7 days.
        #—————————————————————————
        ExceptionFileMaximumAge=7

        The only file that you should modify is the ffdcRun.properties file. You can change the value of ExceptionFileMaximumAge property. This property specifies the number of days that an FFDC log remains in the <profileroot>/logs/ffdc directory before being deleted.

        There are two artifacts which are produced by FFDC, the information can be located in the <Install Root>/logs/FFDC directory:

        1. * Exception Logs:<ServerName>_Exception.log here mgr_exception.log
        2. * Incident Stream:<ServerName>_<threadid>_<timeStamp>_<SequenceNumber>.txt

        exa Exception Logs [was61@IBM]$ du -a | grep exception.log
        4       ./WebSphere/AppServer/profiles/Profile01/dmgr/logs/ffdc/dmgr_exception.log
        896     ./WebSphere/AppServer/profiles/Profile01/Node/logs/ffdc/server_member2_exception.log
        868     ./WebSphere/AppServer/profiles/Profile01/Node/logs/ffdc/server_member1_exception.log
        4       ./WebSphere/AppServer/profiles/Profile01/Node/logs/ffdc/nodeagent_exception.log

        exa Incident Stream /opt/IBM/WebSphere/AppServer/profiles/Profile01/dmgr/logs
        [logs]$ cd ffdc/
        [ffdc]$ ls -lrt
        -rw-r–r– 1 was61 was61  6607 Aug 14 07:07 dmgr_0000000a_11.08.14_07.07.09_0.txt
        -rw-r–r– 1 was61 was61  1082 Aug 14 07:07 dmgr_exception.log
        -rw-r–r– 1 was61 was61  5916 Aug 14 07:07 dmgr_00000011_11.08.14_07.07.12_0.txt

        We can relate the incident file with the exception.log file by taking the probeid from the incident file and searching for it in the exception.log file. You will notice that timestamps also match.

        $vi dmgr_00000011_11.08.14_07.07.12_0.txt

        ——Start of DE processing—— = [14/08/11 07:07:12:086 BST] , key = java.io.IOException com.ibm.ws.management.discovery.DiscoveryService.sendQuery 165
        Exception = java.io.IOException
        Source = com.ibm.ws.management.discovery.DiscoveryService.sendQuery
        probeid = 165

        $vi dmgr_exception.log

        Index  Count   Time of last Occurrence   Exception SourceId ProbeId
        ——+——+—————————+————————–
        1      1   14/08/11 07:07:05:200 BST org.omg.CORBA.BAD_OPERATION com.ibm.ws.naming.jndicos.CNContextImpl.isLocal 3510
        ——+——+—————————+————————–
        +    2      1   14/08/11 07:07:08:047 BST com.ibm.websphere.security.EntryNotFoundException com.ibm.ws.security.auth.ContextManagerImpl.runAs 4162
        +    3      1   14/08/11 07:07:08:050 BST com.ibm.websphere.wim.exception.EntityNotFoundException com.ibm.websphere.security.EntryNotFoundException 170
        +    4      1   14/08/11 07:07:08:064 BST com.ibm.websphere.security.EntryNotFoundException com.ibm.ws.security.role.RoleBasedConfiguratorImpl.fillMissingAccessIds 542
        +    5      1   14/08/11 07:07:09:325 BST com.ibm.wkplc.extensionregistry.util.XmlUtilException class com.ibm.wkplc.extensionregistry.RegistryLoader.restore 1
        +    6      1   14/08/11 07:07:12:086 BST java.io.IOException com.ibm.ws.management.discovery.DiscoveryService.sendQuery 165

        1. Exception Log: Row elements
        The exception logs contains all of the exception paths which have been encountered since the server has started. Due to optimizations in the data collection, the table was created to give an over view of the exceptions which have been encountered in the server. A entry in the table look like this :
        ———————————————————————–
        Index  Occur  Time of last Occurence   Exception SourceId ProbeId
        ———————————————————————–
        18      1   11/24/10 15:29:59:893 GMT com.ibm.websphere.security.auth.WSLoginFailedException com.ibm.ws.security.auth.JaasLoginHelper.jaas_login 487
        19      8   11/24/10 15:29:23:819 GMT javax.net.ssl.SSLHandshakeException com.ibm.ws.security.orbssl.WSSSLClientSocketFactoryImpl.createSSLSocket 540
        20      1   11/24/10 15:29:59:838 GMT com.ibm.websphere.security.PasswordCheckFailedException com.ibm.ws.security.auth.ContextManagerImpl.runAs 4101
        21      2   11/24/10 15:29:23:979 GMT com.ibm.websphere.management.exception.ConnectorException com.ibm.ws.management.RoutingTable.Accessor.getConnector 583
        ——+——+—————————+————————–

        The first element in the row is a simply index, this is simply used to determine the number of rows in the table. In some entries, a ‘+’ may appear in the first column, this indicates that the row has been added to the table since the last time the entire table was dunmped.

        The second element is the number of occurences. This is useful to see if there is an unusual number of exceptions which are occurring.

        The third element in the row, is a time stamp for the last occurence of the exeception. This is useful in looking at exceptions which have occurred at about the same time.

        The last element in the row is a combination of values. This consists of the exception name, a source Id and the probe Id. This information is useful to locate information in the incident steam about the specific failure.

        File content :  The make up of the file can be a little confusing when first viewed. The file is a accumulation of all of the dumps which have occurred over the life of the server. This means that much of the informaion in the file is out of data, and does not apply to the current server. The most relevent information is the last (tail) of the file.

        It is quite easy to locate the last dump of the exception table. The dump will be deliminated by ‘——————-…’. Entries which begin with a ‘+’ appear outside the delimination of the table, and indicate that they are additions to the table since the last time the table was dumped. (Again due to performance concerns, the table is dump only periodically, and when the server is stopping).

        The information in the above file is displayed in the unordered form as the hash table. A more viewable form of the file would be to actually sort the output based upon the time stamp. (This is done by using mks commands, hopefully there are available on your system).

        Sorted output of only the last dump of the exception table for Server1_Exception.log. This is done by the following command :
        tail -n<n> <servername>_exception.log | sort -k4n
        where n is the number exceptions in the exception table plus 1 (use the index value to determine this value). <servername> is the name of the server.
        Note: The sort key needs a little work for servers which have rolled the data.

        2. Incident Stream
        The incident stream contains more details about exceptions which have been encountered during the running of the server. Depending on the configuration of the property files, the content of the incident streams will vary.

        The default settings of the property files, the incident stream will not contain exception information for exceptions which were encountered during the start of the server (due to the Level=1 in the ffdcStart.properties). But where the server does to ready, and new exeception which is encountered will be processed.

        The incident stream files should be used in conjunction of the exception log. The values which are contained in the exception log, in most instances will have a corresponding entry in the incident stream. The relationship between the exception log and the incident stream is the hash code which is made up of the exception type, the source Id, and the probe Id. The simpliest way to look at this information is to use the grep command. The information is not all contained on the same line, if you need to know the exact file containing the value, you can use a compound grep command.

        File content  : The file contains information on exception which have been encountered. Each exception will contain information which corresponds to the information (exception name, source Id and the probe Id) contained in the exception table (documented above). If the catch of the exception is a non-static method, the content of the this pointer. In some instances, if there is a diagnostic module which corresponds to the current execution, the DM will write the information about the state of the object to the incident stream.

        The call stack will also be written to the incident stream.

        In some instances, there may be an exception which was encountered while the server is running which will not produce a call stack. This is because the exception was encountered during the start of the server, and since the server started, the exception is considered to be a normal path exception. All of the exception can be seen by either looking at all of the runtime exceptions, or looking at all of the exceptions.

        Websphere FAQ : Clustering, Deployment Manager & Node Agent

        Posted by Sagar Patil

        How does Deployment Manager and node Agent work together? Does deployment manager send message to node agent actively or node agent sends message to deployment manage?

        It’s JMX-based. I suppose it’s pull, because the time interval is specified per Node Agent. When the Node Agent is started, it will discover the Deployment Manager, so it should be pretty direct.

        How can I adjust time interval between the node agent and deployment manager?

        http://publib.boulder.ibm.com/infoce…chservice.html

        Will my application run even if the deployment manager is down.

        Yes

        Does cluster members maintains IPs of other cluster members and can communicate with each other for the session persistence,including the session back up and retrieval, without the help of the deployment manager?

        No, routing to cluster members is done by the plugin at the HTTP server. It has nothing to do with the deployment manager.

        Who participate in clustering udder websphere?

        For WAS  5 : DM and Node Agent participate in high-availability under WAS 5. Websphere cluster has capability of session maintenance, which means that normally if a cluster member is down, the request session it deals with can be forwarded to other cluster members,which have knowledge of this request session. Hence DM is much needed, If deployment manager do not know cluster member B to which the request is forwarded, cluster member B will not have knowledge of the request session and it might deal with the request incorrectly. So deployment manager should know its cluster members as soon as possible to distribute the session state.

        But under WAS 6, DMGR can be stopped. Only admin tasks are not possible anymore if DMGR is down.

        What happens if a cluster member is down? The session backup on this cluster member is lost for sure. How long it takes for the owner to detect the failure of the backup server? How can I adjust this time interval?

        If a cluster member is down, the plugin routes to another member. As there is no in memory copy of the session, the new server will attempt to retrieve, either from the database or from a replica, depending on how you configured it. There are 2 options, memory to memory and database persistence to store session details.

        What heppen if cluster member becomes alive again? How long it takes for other cluster members to detect it and how can I adjust this time?

        Other cluster members don’t care.

        If deployment manager is down,How can the session backup information transfered to other cluster members? Is web server necessary?

        Not necessarily, no. The WAS plugin will automatically fail over requests for a down server to some other server in the same cluster. It’s up to you to configure session persistence so that the session is available to any other server in the cluster. You can use peer clustering or client server clustering, as described here: http://publib.boulder.ibm.com/infoce…ry2memory.html

        How cluster session replication is done

        Cluster members do not know each other, only web server and plugin know all cluster members. When web server receives a new requests, it will forward it to a cluster member WAS. For the session backup replication and only one replica is used), the web server or the plugin will choose another cluster member WAS and copy and update session state to that cluster member at the same time.
        When the owner of the session is down, the web server will forward requests belonging to that session to the a new cluster member. If the new cluster member is the backup cluster member,then it already have the knowledge of the session; if not, then the new cluster member will ask the web server or the plugin to get the information of the session back up cluster member and finally get the session knowledge from that backup cluster member.

        Note ;Session replication is not done by the plugin, that is done the data replication service.

        Websphere Basics

        Posted by Sagar Patil

        Basic Definitions:

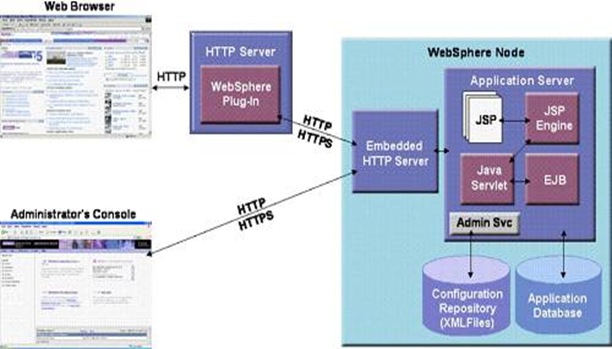
        WebSphere architectures contain one or more computer systems, which are referred to in WebSphere terminology as nodes. Nodes exist within a WebSphere cell. A WebSphere cell can contain one node on which all software components are installed or multiple nodes on which the software components are distributed.

        A typical WebSphere cell contains software components that may be installed on one node or distributed over multiple nodes for scalability and reliability purposes. These include the following:

        • A Web server that provides HTTP services
        • A database server for storing application data
        • WebSphere Application Server (WAS) V5

        clip_image002

        HTTP server
        The HTTP server, more typically known as the Web server, accepts page requests from Web browsers and returns Web page content to Web browsers using the HTTP protocol. Requests for Java servlets and JavaServer Pages (JSPs) are passed by the Web server to WebSphere for execution. WebSphere executes the servlet or JSP and returns the response to the Web server, which in turn forwards the response to the Web browser for display.

        WebSphere V5 supports numerous Web servers such as Apache, Microsoft IIS, Netscape and Domino. However, WebSphere has the tightest integration with Domino because IBM provides single sign-on capabilities between WebSphere and Domino.

        WebSphere plug-in
        The WebSphere plug-in integrates with the HTTP Server and directs requests for WebSphere resources (servlets, JSPs, etc.) to the embedded HTTP server (see below). The WebSphere plug-in uses a configuration file called plugin-cfg.xml file to determine which requests are to be handled by WebSphere. As applications are deployed to the WebSphere configuration, this file must be regenerated (typically using the Administration Console) and distributed to all Web servers, so that they know which URL requests to direct to WebSphere. This is one of the few manual processes that a WebSphere administrator must do to maintain the WebSphere environment.

        Application server
        The application server provides a run-time environment for J2EE applications (supporting servlets, JSPs, Enterprise JavaBeans, etc.). A node can have one or more application server processes. Each application server runs in its own runtime environment called a Java Virtual Machine (JVM). The JVM provides complete isolation (crash protection) for individual applications servers.

        Application database
        WebSphere applications such as IBM’s commerce and portal products, as well as applications you create yourself, use a relational database for storing configuration information and data. WebSphere V5 ships with the Cloudscape database and supports a wide range of database product, including the following:

        • IBM DB2
        • Informix
        • Oracle
        • SQL Server
        • Sybase

        Administration console
        The administration console provides a Web-based interface for managing a WebSphere cell from a central location. The administration console can be used to change the configuration of any node within the cell at run-time. Configuration changes are automatically distributed to other nodes in the cell.

        Cell:

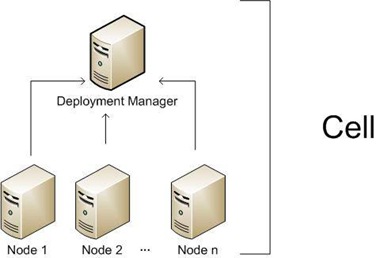
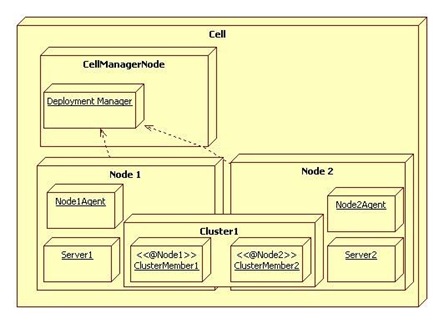
        A Cell is a virtual unit that is built of a Deployment Manager and one or more nodes.

        clip_image004

        The Deployment Manager is a process (in fact it is an special WebSphere instance) responsible for managing the installation and maintenance of Applications, Connection Pools and other resources related to a J2EE environment. It is also responsible for centralizing user repositories for application and also for WebSphere authentication and authorization.

        The Deployment Manager communicates with the Nodes through another special WebSphere process, the Node Agent.

        The Node is another virtual unit that is built of a Node Agent and one or more Server instances.

        The Node Agent it the process responsible for spawning and killing server processes and also responsible for configuration synchronization between the Deployment Manager and the Node. Extra care must be taken when changing security configurations for the cell, since communication between Deployment Manager and Node Agent is ciphered and secured when security is enabled, Node Agent needs to have configuration fully resynchronized when impacting changes are made to Cell security configuration.

        Servers are regular Java process responsible for serving J2EE requests (eg.: serving JSP/JSF pages, serving EJB calls, consuming JMS queues, etc).

        Clusters

        And to finish, Clusters are also virtual units that groups Servers so resources added to the Cluster are propagated to every Server that makes up the cluster, this will in fact affect usually more than a single Node instance.

        clip_image006

        Tuning Java virtual Machines

        Posted by Sagar Patil

        The application server, being a Java process, requires a Java virtual machine (JVM) to run, and to support the Java applications running on it. As part of configuring an application server, you can fine-tune settings that enhance system use of the JVM.

        A JVM provides the runtime execution environment for Java based applications. WebSphere Application Server is a combination of a JVM runtime environment and a Java based server runtime. It can run on JVMs from different JVM providers. To determine the JVM provider on which your Application Server is running, issue the java -fullversion command from within your WebSphere Application Server app_server_root/java/bin directory. You can also check the SystemOut.log from one of your servers. When an application server starts, Websphere Application Server writes information about the JVM, including the JVM provider information, into this log file.

        From a JVM tuning perspective, there are two main types of JVMs:

        * IBM JVMs
        * Sun HotSpot based JVMs, including Sun HotSpot JVM on Solaris and HP’s JVM for HP-UX

        Even though JVM tuning is dependent on the JVM provider general tuning concepts apply to all JVMs. These general concepts include:

        * Compiler tuning. All JVMs use Just In Time (JIT) compilers to compile Java byte codes into native instructions during server run-time.
        * Java memory or heap tuning. The JVM memory management function, or garbage collection provides one of the biggest opportunities for improving JVM performance.
        * Class loading tuning.

        Procedure

        * Optimize the startup performance and the runtime performance

        In some environments, it is more important to optimize the startup performance of your WebSphere Application Server rather than the runtime performance. In other environments, it is more important to optimize the runtime performance. By default, IBM JVMs are optimized for runtime performance while HotSpot based JVMs are optimized for startup performance.

        The Java JIT compiler has a big impact on whether startup or runtime performance is optimized. The initial optimization level used by the compiler influences the length of time it takes to compile a class method and the length of time it takes to start the server. For faster startups, you can reduce the initial optimization level that the compiler uses. This means that the runtime performance of your applications may be degraded because the class methods are now compiled at a lower optimization level.

        It is hard to provide a specific runtime performance impact statement because the compilers might recompile class methods during runtime execution based upon the compiler’s determination that recompiling might provide better performance. Ultimately, the duration of the application is a major influence on the amount of runtime degradation that occurs. Short running applications have a higher probability of having their methods recompiled. Long-running applications are less likely to have their methods recompiled. The default settings for IBM JVMs use a high optimization level for the initial compiles. You can use the following IBM JVM option if you need to change this behavior:

        -Xquickstart This setting influences how the IBM JVM uses a lower optimization level for class method compiles, which provides for faster server startups, at the expense of runtime performance. If this parameter is not specified, the IBM JVM defaults to starting with a high initial optimization level for compiles. This setting provides faster runtime performance at the expense of slower server starts.

        Default: High initial compiler optimizations level
        Recommended: High initial compiler optimizations level
        Usage: -Xquickstart can provide faster server startup times.

        JVMs based on Sun’s Hotspot technology initially compile class methods with a low optimization level. Use the following JVM option to change this behavior:

        -server JVMs based on Sun’s Hotspot technology initially compile class methods with a low optimization level. These JVMs use a simple complier and an optimizing JIT compiler. Normally the simple JIT compiler is used. However you can use this option to make the optimizing compiler the one that is used. This change will significantly increases the performance of the server but the server takes longer to warm up when the optimizing compiler is used.

        Default: Simple compiler
        Recommended: Optimizing compiler
        Usage: -server enables the optimizing compiler.

        * Set the heap size The following command line parameters are useful for setting the heap size.

        * -Xms This setting controls the initial size of the Java heap. Properly tuning this parameter reduces the overhead of garbage collection, improving server response time and throughput. For some applications, the default setting for this option might be too low, resulting in a high number of minor garbage collections

        Default: 256 MB
        Recommended: Workload specific, but higher than the default.
        Usage: -Xms256m sets the initial heap size to 256 megabytes

        * -Xmx This setting controls the maximum size of the Java heap. Properly tuning this parameter can reduce the overhead of garbage collection, improving server response time and throughput. For some applications, the default setting for this option is too low, resulting in a high number of minor garbage collections.

        Default: 512 MB
        Recommended: Workload specific, but higher than the default.
        Usage: -Xmx512m sets the maximum heap size to 512 megabytes

        * -Xlp This setting can be used with the IBM JVM to allocate the heap using large pages. However, if you use this setting your operating system must be configured to support large pages. Using large pages can reduce the CPU overhead needed to keep track of heap memory and might also allow the creation of a larger heap.

        See Tuning operating systems for more information about tuning your operating system.

        * The size you should specify for the heap depends on your heap usage over time. In cases where the heap size changes frequently, you might improve performance if you specify the same value for the Xms and Xmx parameters.

        * Tune the IBM JVM’s garbage collector.

        Use the Java -X option to see the list of memory options.

        * -Xgcpolicy Setting gcpolicy to optthruput disables concurrent mark. If you do not have pause time problems, denoted by erratic application response times, you should get the best throughput using this option. Setting gcpolicy to optavgpause enables concurrent mark with its default values. This setting alleviates erratic application response times caused by normal garbage collection. However, this option might decrease overall throughput.

        Default: optthruput
        Recommended: optthruput
        Usage: Xgcpolicy:optthruput

        * -Xnoclassgc By default the JVM unloads a class from memory when there are no live instances of that class left, but this can degrade performance. Turning off class garbage collection eliminates the overhead of loading and unloading the same class multiple times.

        If a class is no longer needed, the space that it occupies on the heap is normally used for the creation of new objects. However, if you have an application that handles requests by creating a new instance of a class and if requests for that application come in at random times, it is possible that when the previous requester is finished, the normal class garbage collection will clean up this class by freeing the heap space it occupied, only to have to re-instantiate the class when the next request comes along. In this situation you might want to use this option to disable the garbage collection of classes.

        Avoid trouble: This option should be used with caution, if your application creates classes dynamically, or uses reflection, because for this type of application, the use of this option can lead to native memory exhaustion, and cause the JVM to throw an Out-of-Memory Exception. When this option is used, if you have to redeploy an application, you should always restart the application server to clear the classes and static data from the pervious version of the application.gotcha

        Default: class garbage collection enabled
        Recommended: class garbage collection disabled
        Usage: Xnoclassgc disables class garbage collection

        * Tune the Sun JVM’s garbage collector

        On the Solaris platform, the WebSphere Application Server runs on the Sun Hotspot JVM rather than the IBM JVM. It is important to use the correct tuning parameters with the Sun JVM in order to utilize its performance optimizing features.

        The Sun HotSpot JVM relies on generational garbage collection to achieve optimum performance. The following command line parameters are useful for tuning garbage collection.

        * -XX:SurvivorRatio The Java heap is divided into a section for old (long lived) objects and a section for young objects. The section for young objects is further subdivided into the section where new objects are allocated (eden) and the section where new objects that are still in use survive their first few garbage collections before being promoted to old objects (survivor space). Survivor Ratio is the ratio of eden to survivor space in the young object section of the heap. Increasing this setting optimizes the JVM for applications with high object creation and low object preservation. Since WebSphere Application Server generates more medium and long lived objects than other applications, this setting should be lowered from the default.

        Default: 32
        Recommended: 16
        Usage: -XX:SurvivorRatio=16

        * -XX:PermSize The section of the heap reserved for the permanent generation holds all of the reflective data for the JVM. This size should be increased to optimize the performance of applications that dynamically load and unload a lot of classes. Setting this to a value of 128MB eliminates the overhead of increasing this part of the heap.

        Recommended: 128 MB
        Usage: XX:PermSize=128m sets perm size to 128 megabytes.

        * -Xmn This setting controls how much space the young generation is allowed to consume on the heap. Properly tuning this parameter can reduce the overhead of garbage collection, improving server response time and throughput. The default setting for this is typically too low, resulting in a high number of minor garbage collections. Setting this setting too high can cause the JVM to only perform major (or full) garbage collections. These usually take several seconds and are extremely detrimental to the overall performance of your server. You must keep this setting below half of the overall heap size to avoid this situation.

        Default: 2228224 bytes
        Recommended: Approximately 1/4 of the total heap size
        Usage: -Xmn256m sets the size to 256 megabytes.

        * -Xnoclassgc By default the JVM unloads a class from memory when there are no live instances of that class left, but this can degrade performance. Turning off class garbage collection eliminates the overhead of loading and unloading the same class multiple times.

        If a class is no longer needed, the space that it occupies on the heap is normally used for the creation of new objects. However, if you have an application that handles requests by creating a new instance of a class and if requests for that application come in at random times, it is possible that when the previous requester is finished, the normal class garbage collection will clean up this class by freeing the heap space it occupied, only to have to re-instantiate the class when the next request comes along. In this situation you might want to use this option to disable the garbage collection of classes.

        Default: class garbage collection enabled
        Recommended: class garbage collection disabled
        Usage: Xnoclassgc disables class garbage collection

        * Tune the HP JVM’s garbage collector

        The HP JVM relies on generational garbage collection to achieve optimum performance. The following command line parameters are useful for tuning garbage collection.

        * -Xoptgc This setting optimizes the JVM for applications with many short-lived objects. If this parameter is not specified, the JVM usually does a major (full) garbage collection. Full garbage collections can take several seconds and can significantly degrade server performance.

        Default: off
        Recommended: on
        Usage: -Xoptgc enables optimized garbage collection.

        * -XX:SurvivorRatio The Java heap is divided into a section for old (long lived) objects and a section for young objects. The section for young objects is further subdivided into the section where new objects are allocated (eden) and the section where new objects that are still in use survive their first few garbage collections before being promoted to old objects (survivor space). Survivor Ratio is the ratio of eden to survivor space in the young object section of the heap. Increasing this setting optimizes the JVM for applications with high object creation and low object preservation. Since WebSphere Application Server generates more medium and long lived objects than other applications, this setting should be lowered from the default.

        Default: 32
        Recommended: 16
        Usage: -XX:SurvivorRatio=16

        * -XX:PermSize The section of the heap reserved for the permanent generation holds all of the reflective data for the JVM. This size should be increased to optimize the performance of applications which dynamically load and unload a lot of classes. Specifying a value of 128 megabytes eliminates the overhead of increasing this part of the heap.

        Default: 0
        Recommended: 128 megabytes
        Usage: -XX:PermSize=128m sets PermSize to 128 megabytes

        * -XX:+ForceMmapReserved By default the Java heap is allocated “lazy swap.” This saves swap space by allocating pages of memory as needed, but this also forces the use of 4KB pages. This allocation of memory can spread the heap across hundreds of thousands of pages in large heap systems. This command disables “lazy swap” and allows the operating system to use larger memory pages, thereby optimizing access to the memory making up the Java heap.

        Default: off
        Recommended: on
        Usage: -XX:+ForceMmapReserved will disable “lazy swap”.

        * -Xmn This setting controls how much space the young generation is allowed to consume on the heap. Properly tuning this parameter can reduce the overhead of garbage collection, improving server response time and throughput. The default setting for this is typically too low, resulting in a high number of minor garbage collections.

        Default: No default
        Recommended: Approximately 1/4 of the total heap size
        Usage: -Xmn256m sets the size to 256 megabytes

        * Virtual Page Size Setting the Java virtual machine instruction and data page sizes to 64MB can improve performance.

        Default: 4MB
        Recommended: 64MB
        Usage: Use the following command. The command output provides the current operating system characteristics of the process executable:

        chatr +pi64M +pd64M /opt/WebSphere/
        AppServer/java/bin/PA_RISC2.0/
        native_threads/java

        * -Xnoclassgc By default the JVM unloads a class from memory when there are no live instances of that class left, but this can degrade performance. Turning off class garbage collection eliminates the overhead of loading and unloading the same class multiple times.

        If a class is no longer needed, the space that it occupies on the heap is normally used for the creation of new objects. However, if you have an application that handles requests by creating a new instance of a class and if requests for that application come in at random times, it is possible that when the previous requester is finished, the normal class garbage collection will clean up this class by freeing the heap space it occupied, only to have to re-instantiate the class when the next request comes along. In this situation you might want to use this option to disable the garbage collection of classes.

        Default: class garbage collection enabled
        Recommended: class garbage collection disabled
        Usage: Xnoclassgc disables class garbage collection

        Webspehere java 100% CPU usage : MustGather Information

        Posted by Sagar Patil

        Perform the following setup instructions:
        1.    Follow instructions to enable verbosegc in WebSphere Application Server

        2.    Run the following command:

        top -d %delaytime% -c -b > top.log

        Where delaytime is the number of seconds to delay. This must be 60 seconds or greater, depending on how soon the failure is expected.

        3.    Run the following:

        netstat -an > netstat1.out

        4.    Run the following:

        kill -3 [PID_of_problem_JVM]

        The kill -3 command will create javacore*.txt files or javacore data written to the stderr file of the Application Server.
        Note: If you are not able to determine which JVM process is experiencing the high CPU usage then you should issue the kill -3 PID for each of the JVM processes.

        5.    Wait two minutes. Run the following:

        kill -3 [PID_of_problem_JVM]

        6.    Wait two minutes. Run the following:

        netstat -an > netstat2.out

        7.    If you are unable to generate javacore files, then perform the following:

        kill -11 [PID_of_problem_JVM]

        The kill -11 will terminate the JVM process, produce a core file, and possibly a javacore.

        Collect following documentation for uploading to IBM support:

        – All Application Server JVM log files for the Application Server experiencing the problem.
        – All administrative server log files from the machine experiencing the problem.
        – WebSphere Application Server plug-in log
        – Web server error and access log
        – top.log, ps_eLf.log and vmstat.log
        – javacore*.*
        – All netstat*.out files
        – /var/log/messages
        – Indicate which JVM, such as the Application Server or administrative server, is experiencing the problem.

        Http Error Codes

        Posted by Sagar Patil

        Have you ever wondered what the codes listed at Apache acces_log mean

        172.21.90.160 – – [05/Jan/2010:08:15:42 +0000] “GET HTTP/1.1” 200 554
        172.21.90.160 – – [05/Jan/2010:08:15:42 +0000] “GET  HTTP/1.1” 304
        172.21.90.160 – – [05/Jan/2010:08:15:42 +0000] “GET HTTP/1.1” 304 Read more…

        Was my rman backup successful?

        Posted by Sagar Patil

        I have more than 100 database servers.

        How can I report if my backup was successful last night or last week?

        Normally one can use shell scripts and grep rman log for errors but here is a better way.

        select to_char(START_TIME,’DD MON YY HH24:Mi’) START_TIME ,
        to_char(END_TIME,’DD MON YY HH24:Mi’) END_TIME ,
        OUTPUT_BYTES/1000000  PROCESSED_IN_MB,STATUS
        from v$rman_status where trunc(START_TIME)= trunc(sysdate)

        Please edit trunc(sysdate) for DAY you need to see backup details

        START_TIME      END_TIME        PROCESSED_IN_MB STATUS
        ————— ————— ————— ———————–
        25 JAN 10 15:05 25 JAN 10 15:07      2041.57747 RUNNING
        25 JAN 10 15:05 25 JAN 10 15:07               0 RUNNING
        25 JAN 10 07:00 25 JAN 10 07:00               0 COMPLETED
        25 JAN 10 14:50 25 JAN 10 14:51               0 FAILED
        25 JAN 10 14:48 25 JAN 10 14:48               0 COMPLETED
        25 JAN 10 07:00 25 JAN 10 07:00               0 COMPLETED
        25 JAN 10 14:50 25 JAN 10 14:51               0 COMPLETED WITH ERRORS
        25 JAN 10 07:00 25 JAN 10 07:00               0 COMPLETED WITH WARNINGS
        25 JAN 10 14:48 25 JAN 10 14:48               0 COMPLETED
        25 JAN 10 07:00 25 JAN 10 07:00               0 COMPLETED

        I want to see if my backups are growing over time.

        select trunc(START_TIME),sum(OUTPUT_BYTES)/1000000  PROCESSED_IN_MB
        from v$rman_status where STATUS =’COMPLETED’
        group by trunc(START_TIME)
        order by 1 desc

        TRUNC(START_TIME) PROCESSED_IN_MB
        08/07/2010 0
        07/07/2010 109935.0671
        06/07/2010 50093.3591
        05/07/2010 49868.96384
        04/07/2010 49808.14643
        03/07/2010 49803.95213
        02/07/2010 49801.85498
        01/07/2010 99461.10362
        30/06/2010 51695.32109
        How much of TAPE/Disk space have been used by backups
        select sum(OUTPUT_BYTES)/1000000  PROCESSED_IN_MB
        from v$rman_status where STATUS =’COMPLETED’
        Were there any backups with Errors?
        select to_char(START_TIME,’DD MON YY HH24:Mi’) START_TIME ,STATUS,OPERATION
        from v$rman_status where STATUS like ‘%ERROR%’
        order by 1 desc

        Websphere FAQ/Terms Explained

        Posted by Sagar Patil
        • · What is a Node?

        WebSphere architectures contain one or more computer systems, which are referred to in WebSphere terminology as nodes. Nodes exist within a WebSphere cell. A WebSphere cell can contain one node on which all software components are installed or multiple nodes on which the software components are distributed.

        • · What is a Node agent?

        Node agents are administrative agents that route administrative requests to servers.

        A node agent is a server that runs on every host computer system that participates in the WebSphere Application Server Network Deployment product. It is purely an administrative agent and is not involved in application serving functions. A node agent also hosts other important administrative functions such as file transfer services, configuration synchronization, and performance monitoring.

        • What is a cluster?

        A cluster is a set of application servers that are managed together and participate in workload management. In a distributed environment, you can cluster any of the WebSphere Everyplace Access server components. Each server is installed on a separate node and managed by a Network Deployment node. Cluster members have identical application components, but can be sized differently in terms of weight, heap size, and other environmental factors. The weighted load balancing policies are defined and controlled by the web server plug-in. starting or stopping the cluster automatically starts or stops all the cluster members, and changes to the application are propagated to all server members in the cluster. The servers in clusters share the same database.

        • What is Work Load Management?

        Workload management optimizes the distribution of work-processing tasks in the WebSphere Application Server environment. Incoming work requests are distributed to the application servers and other objects that can most effectively process the requests. Workload management also provides failover when servers are not available.

        Workload management is most effective when used in systems that contain servers on multiple machines. It also can be used in systems that contain multiple servers on a single, high-capacity machine. In either case, it enables the system to make the most effective use of the available computing resources.

        • What is “dumpNameSpace.sh”?

        WebSphere Application Server provides a command line utility for creating a JNDI namespace extract of a dedicated application server. This utility is named dumpNameSpace.sh

        • What is JNDI?

        The Java Naming and Directory Interface (JNDI) is part of the Java platform, providing applications based on Java technology with a unified interface to multiple naming and directory services. JNDI works in concert with other technologies in the Java Platform, Enterprise Edition (Java EE) to organize and locate components in a distributed computing environment.

        • What is a JVM?

        A Java Virtual Machine (JVM) is a virtual machine that interprets and executes Java bytecode. This code is most often generated by Java language compilers, although the JVM can also be targeted by compilers of other languages. JVM’s may be developed by other companies as long as they adhere to the JVM standard published by Sun.

        The JVM is a crucial component of the Java Platform. The availability of JVMs on many types of hardware and software platforms enables Java to function both as middleware and a platform in its own right. Hence the expression “Write once, run anywhere.” The use of the same bytecode for all platforms allows Java to be described as “Compile once, run anywhere”, as opposed to “Write once, compile anywhere”, which describes cross-platform compiled languages.

        • What is JAVA?

        Java is an object-oriented language similar to C++, but simplified to eliminate language features that cause common programming errors. Java source code files (files with a .java extension) are compiled into a format called bytecode (files with a .class extension), which can then be executed by a Java interpreter. Compiled Java code can run on most computers because Java interpreters and runtime environments, known as Java Virtual Machines (VMs), exist for most operating systems, including UNIX, the Macintosh OS, and Windows. Bytecode can also be converted directly into machine language instructions by a just-in-time compiler (JIT).

        Java is a general purpose programming language with a number of features that make the language well suited for use on the World Wide Web.

        • What is JVM Heap Size?

        The Java heap is where the objects of a Java program live. It is a repository for live objects, dead objects, and free memory. The JVM heap size determines how often and how long the VM spends collecting garbage.

        • What is Tivoli Performance Viewer (TPV)?

        Tivoli Performance Viewer (TPV) enables administrators and programmers to monitor the overall health of WebSphere Application Server from within the administrative console. By viewing TPV data, administrators can determine which part of the application and configuration settings to change in order to improve performance. For example, you can view the servlet summary reports, enterprise beans, and Enterprise JavaBeans (EJB) methods in order to determine what part of the application to focus on. Then, you can sort these tables to determine which of these resources has the highest response time. Focus on improving the configuration for those application resources taking the longest response time.

        For example, you can view the servlet summary reports, enterprise beans, and Enterprise JavaBeans (EJB) methods in order to determine what part of the application to focus on. Then, you can sort these tables to determine which of these resources has the highest response time. Focus on improving the configuration for those application resources taking the longest response time.

        • What does syncNode.sh do?

        The syncNode command forces a configuration synchronization to occur between the node and the deployment manager for the cell in which the node is configured. Only use this command when you cannot run the node agent because the node configuration does not match the cell configuration.

        • What does addNode.sh do?

        The addNode command incorporates a WebSphere Application Server installation into a cell. You must run this command from the install_root/bin directory of a WebSphere Application Server installation. Depending on the size and location of the new node you incorporate into the cell, this command can take a few minutes to complete.

        • What does removeNode.sh do?

        The removeNode command returns a node from a Network Deployment distributed administration cell to a base WebSphere Application Server installation.

        The removeNode command only removes the node-specific configuration from the cell. This command does not uninstall any applications that were installed as the result of executing an addNode command. Such applications can subsequently deploy on additional servers in the Network Deployment cell. As a consequence, an addNode command with the -includeapps option executed after a removeNode command does not move the applications into the cell because they already exist from the first addNode command. The resulting application servers added on the node do not contain any applications. To deal with this situation, add the node and use the deployment manager to manage the applications. Add the applications to the servers on the node after it is incorporated into the cell.

        The removeNode command does the following:

        · Stops all of the running server processes in the node, including the node agent process.

        · Removes the configuration documents for the node from the cell repository by sending commands to the deployment manager.

        · Copies the original application server cell configuration into the active configuration.

        • What does backupConfig.sh do?

        Use the backupConfig utility to back up your WebSphere Application Server V5.0 node configuration to a file. By default, all servers on the node stop before the backup is made so that partially synchronized information is not saved. You can run this utility by issuing a command from the bin directory of a WebSphere Application Server installation or a network deployment installation.

        • What does restoreConfig.sh do?

        The restoreConfig command is a simple utility to restore the configuration of your node after backing up the configuration using the backupConfig command. By default, all servers on the node stop before the configuration restores so that a node synchronization does not occur during the restoration. If the configuration directory already exists, it will be renamed before the restoration occurs.

        • What does WASPreUpgrade.sh do?

        The WASPreUpgrade command is a migration tool that saves the configuration and applications of a previous version or release to a Version WebSphere Application Server node or Network Deployment node.

        • What does WASPost Upgrade.sh do?

        The WASPostUpgrade command is a migration tool for adding the configuration and applications of a previous version or release to the current WebSphere Application Server node. The configuration includes migrated applications. The tool adds all migrated applications into the install_root/installedApps directory of the current product. The tool locates the saved configuration that the WASPreUpgrade tool saves through a parameter you use to specify the backup directory.

        • What is a thread?

        A thread can be loosely defined as a separate stream of execution that takes place simultaneously with and independently of everything else that might be happening. A thread is like a classic program that starts at point A and executes until it reaches point B. It does not have an event loop. A thread runs independently of anything else happening in the computer. Without threads an entire program can be held up by one CPU intensive task or one infinite loop, intentional or otherwise. With threads the other tasks that don’t get stuck in the loop can continue processing without waiting for the stuck task to finish.

        It turns out that implementing threading is harder than implementing multitasking in an operating system. The reason it’s relatively easy to implement multitasking is that individual programs are isolated from each other. Individual threads, however, are not.

        • What is multithreading?

        The ability of an operating system to execute different parts of a program, called threads, simultaneously is called multithreading.

        • What is initial context?

        All naming operations are relative to a context. The initial context implements the Context interface and provides the starting point for resolution of names.

        • What is Web Container thread pool size?

        This value limits the number of requests that your application server can process concurrently.

        • What are the algorithms used for Work Load Management?

        WebSphere supports four specified load-balancing policies:

        1. Round robin
        2. Random
        3. Round robin prefer local
        4. Random prefer local.

        As implied, the last two always select a stub that connects to a local clone, if one is available. The first two apply a round robin or random selection algorithm without consideration of the location of associated clone.

        • How do we increase the JVM heap size?

        1. In the administrative console Servers > Application Servers > server name > Process Definition > Java Virtual Machine.

        2. It can also be increased in the startServer.sh file

        • What are JNDI names and how are they related to the Application Server?

        Java Naming and Directory Interface (JNDI) is a naming service that allows a program or container to register a “popular” name that is bound to an object. When a program wishes to lookup a name, it contacts the naming server, through a well-known port, and provides the public name, perhaps with authorization information. The naming server returns the object or, in some cases, a stub that can be used to interact with the object.

        A JNDI server runs as part of the WebSphere environment. When the container is initiated, it loads the various applications deployed within it. Part of that process involves opening their respective EAR files and, in turn, their JAR files. For EJB container objects, such as entity and session EJBs, they are registered with the local JNDI server. Their public names are derived from their deployment descriptors or as a default value based on the class name. Once the EJB container is operational, the objects within it will be available through the associated JNDI server.

        • What are maximum beans in a pool?

        When an EJB has been in the free pool for the number of seconds specified in Idle Timeout, and the total number of beans in the free pool approaches the maximum beans in free pool specified in this field, idle beans are removed from the free pool.

        • What is plugin-cfg.xml?

        The console operation generates a cell-level plug-in configuration file containing entries for all application servers and clusters on all machines in the cell. he Web server plug-in is installed on the Web server machine, but the configuration file (plugin-cfg.xml) for the plug-in is generated via WebSphere and then moved to the appropriate location on the Web server.

        • How do we debug and error if the customer complaints that he is not able to see the login page?
        1. Traceroute from the client to the server(Pinging the Web Server)
        2. Check for the system statistics(to which the particular request was sent, top, iostat,vmstat,netstat)
        3. Server logs(systemerr.log, activity.log)
        4. If logs do not show any info, take threaddump thrice within 5 minutes
        5. Heapdump (Use Heap Analser…Contains all the objects running in the JVM)
        • What is a WebSphere Plugin?

        The WebSphere plug-in integrates with the HTTP Server and directs requests for WebSphere resources (servlets, JSPs, etc.) to the embedded HTTP server (see below). The WebSphere plug-in uses a configuration file called plugin-cfg.xml file to determine which requests are to be handled by WebSphere. As applications are deployed to the WebSphere configuration, this file must be regenerated (typically using the Administration Console) and distributed to all Web servers, so that they know which URL requests to direct to WebSphere. This is one of the few manual processes that a WebSphere administrator must do to maintain the WebSphere environment.

        • Compare WAS 4.0 / 5.0 / 6.0 ?

        Specialities of WAS 5.0 over 4.0

        1. Full J2EE 1.3 support and support for the Java SDK 1.3.1.
        2. A new administrative model based on the Java Management Extensions(JMX) framework and an XML-based configuration repository. A relational database is no longer required for the configuration repository.
        3. A Web-based administrative console provides a GUI interface for administration.
        4. An interface based on the Bean Scripting Framework, wsadmin, has been provided for administration through scripts. In V5, the only supported scripting language is JACL.
        5. Clustering, workload management, and single point of administration in a multi-node single cell topology
        6. SOAP/JMS support.
        7. Support for Jython scripting language support in wsadmin
        8. In a Network Deployment environment, the application server can now start without the Node Agent running.

        Specialities of v6.0 over v5.0

        J2EE 1.4 support

        1. WebSphere Application Server V6 provides full support for J2EE specification requires a certain set of specifications to be supported. These are EJB 2.1, JMS 1.1, JCA 1.5, Servlet 2.4, and JSP 2.0. WebSphere Application Server V6 also provides support for J2EE 1.2 and 1.3 to ease migration.
        2. Mixed cell support enables you to migrate an existing WebSphere Application Server V5 Network Deployment environment to V6. By migrating the Deployment Manager to V6 as a first step, you can continue to run V5 application servers until you can migrate each of them.
        3. Configuration archiving allows you to create a complete or partial archive of an existing WebSphere Application Server configuration. This archive is portable and can be used to create new configurations based on the archive.
        4. Defining a WebSphere Application Server V6 instance by a profile allows you to easily configure multiple runtimes with one set of install libraries. After installing the product, you create the runtime environment by building profiles.
        5. Defining a generic server as an application server instance in the administration tools allows you to associate it with a non-WebSphere server or process that is needed to support the application server environment.
        6. By defining external Web servers as managed servers, you can start and stop the Web server and automatically push the plug-in configuration to it. This requires a node agent to be installed on the machine and is typically used when the Web server is behind a firewall
        7. You can also define a Web server as an unmanaged server for placement outside the firewall. This allows you to create custom plug-ins for the Web server, but you must manually move the plug-in configuration to the Web server machine.
        8. As a special case, you can define the IBM HTTP server as an unmanaged server, but treat it as a managed server. This does not require a node agent because the commands are sent directly to the IBM HTTP server administration process.
        9. You can use node groups to define a boundary for server cluster formation. With WebSphere Application Server V6, you can now have nodes in cells with different capabilities, for example, a cell can contain both WebSphere Application Server on distributed systems and on z/OS. Node groups are created to group nodes of similar capability together to allow validation during system administration processes.
        10. The Tivoli Performance View monitor has also been integrated into the administrative console.
        11. Enhanced Enterprise Archive (EAR) files can now be built using Rational Application Developer or the Application Server Toolkit. The Enhanced EAR contains bindings and server configuration settings previously done at deployment time. This allows developers to predefine known runtime settings and can speed up deployment.
        12. Fine grain application update capabilities allow you to make small delta changes to applications without doing a full application update and restart.
        13. WebSphere Rapid Deployment provides the ability for developers to use annotation based programming. This is step forward in the automation of application development and deployment.
        14. Failover of stateful session EJBs is now possible. Each EJB container provides a method for stateful session beans to fail over to other servers. This feature uses the same memory to memory replication provided by the data replication services component used for HTTP session persistence.
        • What if the thread is stuck?

        You get to know if a thread is stuck by taking thread dump. If a thread is stuck, you should take the heap dump to know exactly at which object thread is stuck & let developer know about object creating problems.
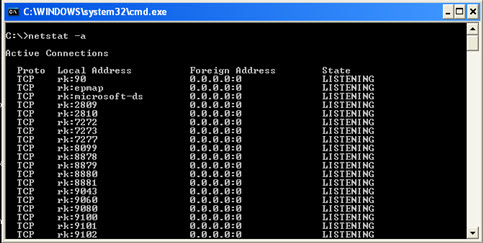
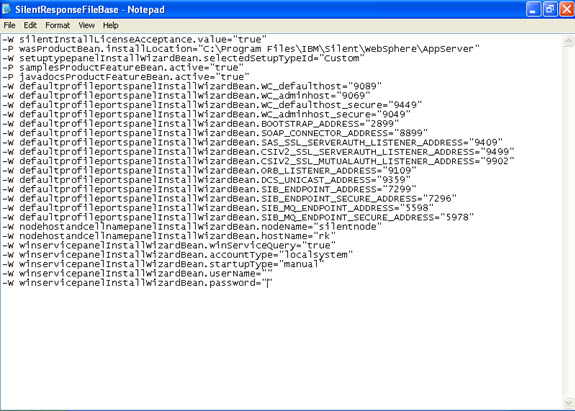
        Weblogic Configuration after Install

        Posted by Sagar Patil

        After an install run config.bat to create default weblogic configuration Read more…

        How to Install WebLogic under Windows

        Posted by Sagar Patil

        WebSphere Log Files /Logging performance data with TPV

        Posted by Sagar Patil

        Plug-In Logs
        WebServer http Plugin will create log, by default named as http-plugin.log, placed under PLUGIN_HOME/logs/
        Plugin writes Error messages into this log. The attribute which deals with this is
        < Log > in the plugin-cfg.xml
        For Example
        < Log LogLevel=”Error” Name=”/opt/IBM/WebSphere/Plugins/logs/http_plugin.log” / >

        To Enable Tracing set Log LogLevel to “Trace”.
        < Log LogLevel=”Trace” Name=”/opt/IBM/WebSphere/Plugins/logs/http_plugin.log” / >

        JVM logs
        $ find /opt/IBM/WebSphere/ -name SystemOut.log -print
        /opt/IBM/WebSphere/AppServer/profiles/%Profile%/Node/logs/member1/SystemOut.log
        /opt/IBM/WebSphere/AppServer/profiles/%Profile%/Node/logs/member2/SystemOut.log
        /opt/IBM/WebSphere/AppServer/profiles/%Profile%/Node/logs/nodeagent/SystemOut.log
        /opt/IBM/WebSphere/AppServer/profiles/%Profile%/Dmgr/logs/Dmgr/SystemOut.log

        NodeAgent Process Log
        /opt/IBM/WebSphere/AppServer/profiles/%Profile%/Node/logs/nodeagent/native_stdout.log
        /opt/IBM/WebSphere/AppServer/profiles/%Profile%/Node/logs/nodeagent/native_stderr.log

        IBM service logs – activity.log
        /opt/IBM/WebSphere/AppServer/profiles/%Profile%/Node/logs/activity.log
        /opt/IBM/WebSphere/AppServer/profiles/%Profile%/Dmgr/logs/activity.log

        ——————————————————————————–

        Enabling automated heap dump generation, DONT DO THIS IN PRODUCTION

        1. Click Servers > Application servers in the administrative console navigation tree.
        2. Click server_name >Performance and Diagnostic Advisor Configuration.
        3. Click the Runtime tab.
        4. Select the Enable automatic heap dump collection check box.
        5. Click OK

        Locating and analyzing heap dumps
        Goto profile_root\myProfile. IBM heap dump files are usually named as heapdump*.phd

        Download and use tools like heapAnalyzer, dumpanalyzer

        ——————————————————————————–

        Logging performance data with TPV(Tivoli Performance Viewer)

          1. Click Monitoring and Tuning > Performance Viewer > Current Activity > server_name > Settings > Log in the console navigation tree. To see the Log link on the Tivoli Performance Viewer page, expand the Settings node of the TPV navigation tree on the left side of the page. After clicking Log, the TPV log settings are displayed on the right side of the page.
          2. Click on Start Logging when viewing summary reports or performance modules.
          3. When finished, click Stop Logging . Once started, logging stops when the logging duration expires, Stop Logging is clicked, or the file size and number limits are reached. To adjust the settings, see step 1.

          By default, the log files are stored in the profile_root/logs/tpv directory on the node on which the server is running. TPV automatically compresses the log file when it finishes writing to it to conserve space. At this point, there must only be a single log file in each .zip file and it must have the same name as the .zip file.

        • View logs.
          1. Click Monitoring and Tuning > Performance Viewer > View Logs in the console navigation tree.
          2. Select a log file to view using either of the following options:
            Explicit Path to Log File
            Choose a log file from the machine on which the browser is currently running. Use this option if you have created a log file and transferred it to your system. Click Browse to open a file browser on the local machine and select the log file to upload.
            Server File
            Specify the path of a log file on the server.In a stand-alone application server environment, type in the path to the log file. The profile_root\logs\tpv directory is the default on a Windows system.
          3. Click View Log. The log is displayed with log control buttons at the top of the view.
          4. Adjust the log view as needed. Buttons available for log view adjustment are described below. By default, the data replays at the Refresh Rate specified in the user settings. You can choose one of the Fast Forward modes to play data at rate faster than the refresh rate.
            Rewind Returns to the beginning of the log file.
            Stop Stops the log at its current location.
            Play Begins playing the log from its current location.
            Fast Forward Loads the next data point every three (3) seconds.
            Fast Forward 2 Loads ten data points every three (3) seconds.

          You can view multiple logs at a time. After a log has been loaded, return to the View Logs panel to see a list of available logs. At this point, you can load another log.

          TPV automatically compresses the log file when finishes writing it. The log does not need to be decompressed before viewing it, though TPV can view logs that have been decompressed.

        Top of Page

        Top menu