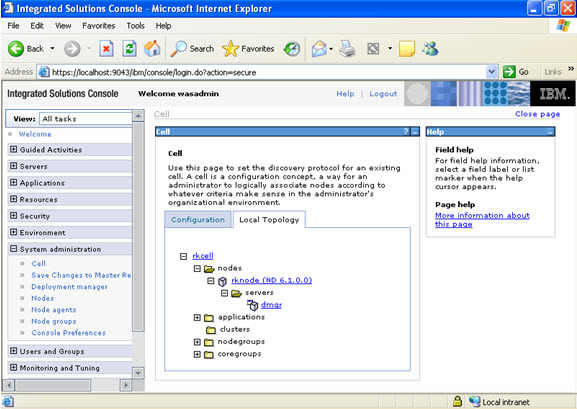
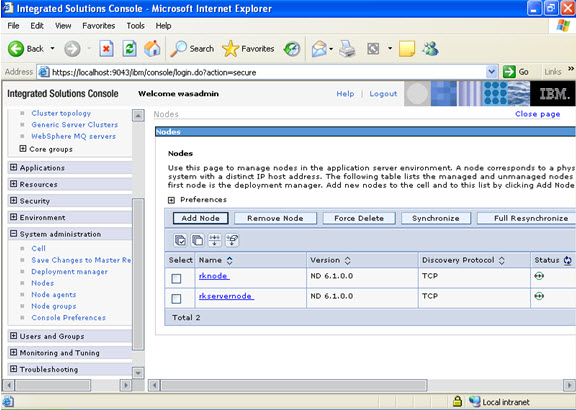
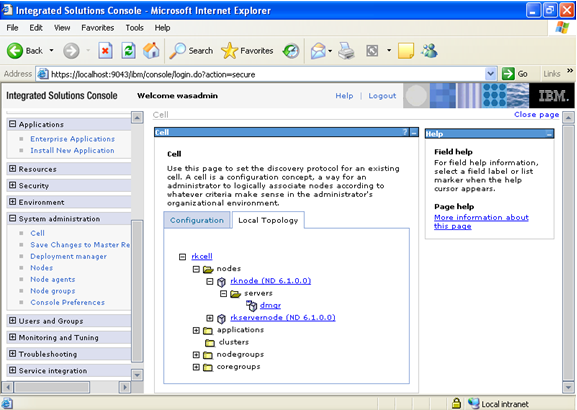
WebSphere architectures contain one or more computer systems, which are referred to in WebSphere terminology as nodes. Nodes exist within a WebSphere cell. A WebSphere cell can contain one node on which all software components are installed or multiple nodes on which the software components are distributed.
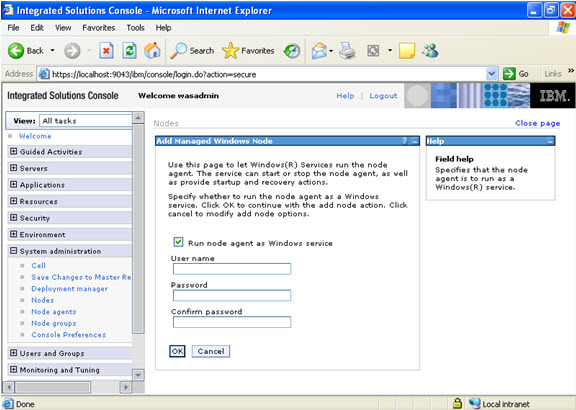
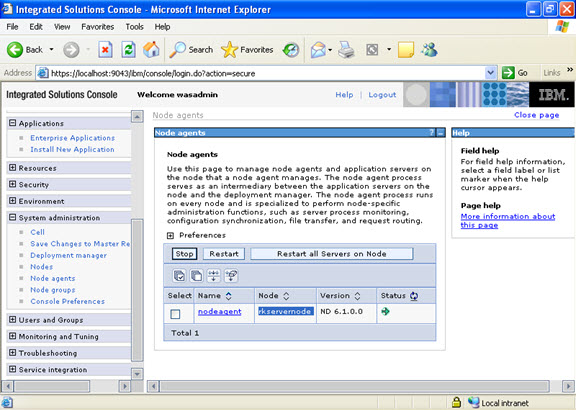
Node agents are administrative agents that route administrative requests to servers.
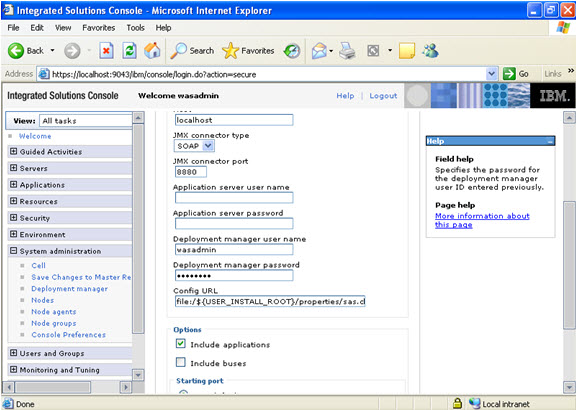
A node agent is a server that runs on every host computer system that participates in the WebSphere Application Server Network Deployment product. It is purely an administrative agent and is not involved in application serving functions. A node agent also hosts other important administrative functions such as file transfer services, configuration synchronization, and performance monitoring.
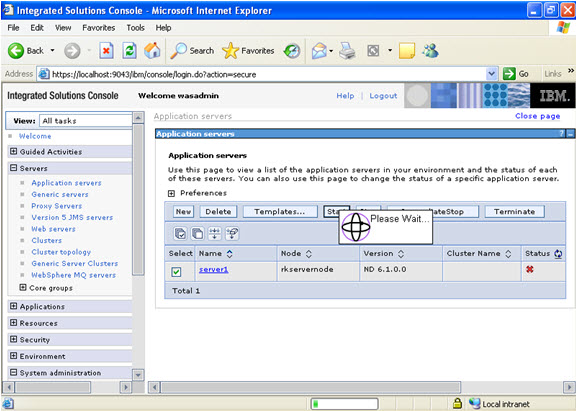
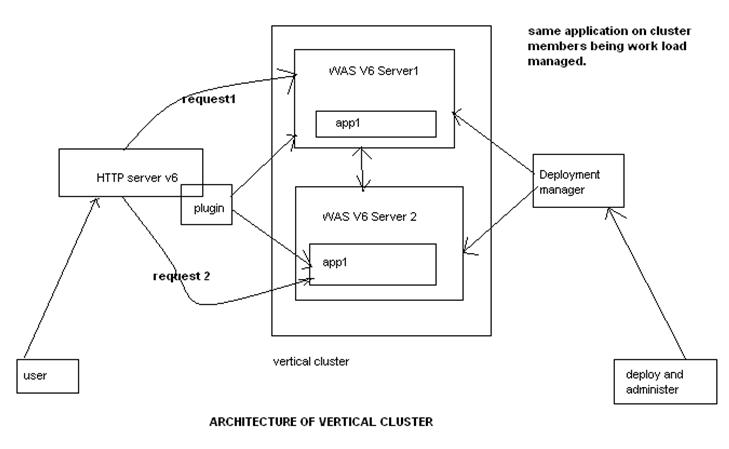
A cluster is a set of application servers that are managed together and participate in workload management. In a distributed environment, you can cluster any of the WebSphere Everyplace Access server components. Each server is installed on a separate node and managed by a Network Deployment node. Cluster members have identical application components, but can be sized differently in terms of weight, heap size, and other environmental factors. The weighted load balancing policies are defined and controlled by the web server plug-in. starting or stopping the cluster automatically starts or stops all the cluster members, and changes to the application are propagated to all server members in the cluster. The servers in clusters share the same database.
- What is Work Load Management?
Workload management optimizes the distribution of work-processing tasks in the WebSphere Application Server environment. Incoming work requests are distributed to the application servers and other objects that can most effectively process the requests. Workload management also provides failover when servers are not available.
Workload management is most effective when used in systems that contain servers on multiple machines. It also can be used in systems that contain multiple servers on a single, high-capacity machine. In either case, it enables the system to make the most effective use of the available computing resources.
- What is “dumpNameSpace.sh”?
WebSphere Application Server provides a command line utility for creating a JNDI namespace extract of a dedicated application server. This utility is named dumpNameSpace.sh
The Java Naming and Directory Interface (JNDI) is part of the Java platform, providing applications based on Java technology with a unified interface to multiple naming and directory services. JNDI works in concert with other technologies in the Java Platform, Enterprise Edition (Java EE) to organize and locate components in a distributed computing environment.
A Java Virtual Machine (JVM) is a virtual machine that interprets and executes Java bytecode. This code is most often generated by Java language compilers, although the JVM can also be targeted by compilers of other languages. JVM’s may be developed by other companies as long as they adhere to the JVM standard published by Sun.
The JVM is a crucial component of the Java Platform. The availability of JVMs on many types of hardware and software platforms enables Java to function both as middleware and a platform in its own right. Hence the expression “Write once, run anywhere.” The use of the same bytecode for all platforms allows Java to be described as “Compile once, run anywhere”, as opposed to “Write once, compile anywhere”, which describes cross-platform compiled languages.
Java is an object-oriented language similar to C++, but simplified to eliminate language features that cause common programming errors. Java source code files (files with a .java extension) are compiled into a format called bytecode (files with a .class extension), which can then be executed by a Java interpreter. Compiled Java code can run on most computers because Java interpreters and runtime environments, known as Java Virtual Machines (VMs), exist for most operating systems, including UNIX, the Macintosh OS, and Windows. Bytecode can also be converted directly into machine language instructions by a just-in-time compiler (JIT).
Java is a general purpose programming language with a number of features that make the language well suited for use on the World Wide Web.
The Java heap is where the objects of a Java program live. It is a repository for live objects, dead objects, and free memory. The JVM heap size determines how often and how long the VM spends collecting garbage.
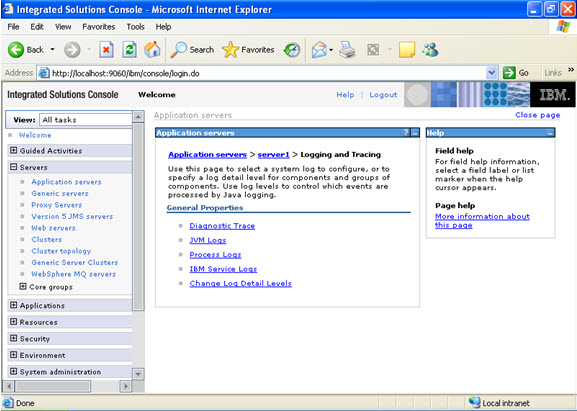
- What is Tivoli Performance Viewer (TPV)?
Tivoli Performance Viewer (TPV) enables administrators and programmers to monitor the overall health of WebSphere Application Server from within the administrative console. By viewing TPV data, administrators can determine which part of the application and configuration settings to change in order to improve performance. For example, you can view the servlet summary reports, enterprise beans, and Enterprise JavaBeans (EJB) methods in order to determine what part of the application to focus on. Then, you can sort these tables to determine which of these resources has the highest response time. Focus on improving the configuration for those application resources taking the longest response time.
For example, you can view the servlet summary reports, enterprise beans, and Enterprise JavaBeans (EJB) methods in order to determine what part of the application to focus on. Then, you can sort these tables to determine which of these resources has the highest response time. Focus on improving the configuration for those application resources taking the longest response time.
- What does syncNode.sh do?
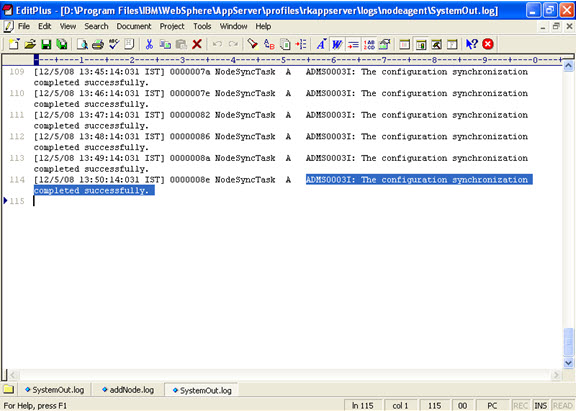
The syncNode command forces a configuration synchronization to occur between the node and the deployment manager for the cell in which the node is configured. Only use this command when you cannot run the node agent because the node configuration does not match the cell configuration.
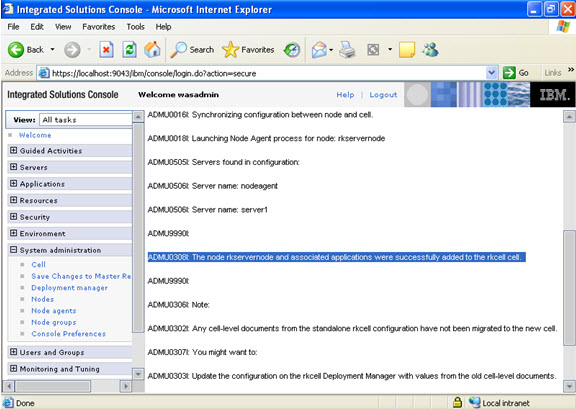
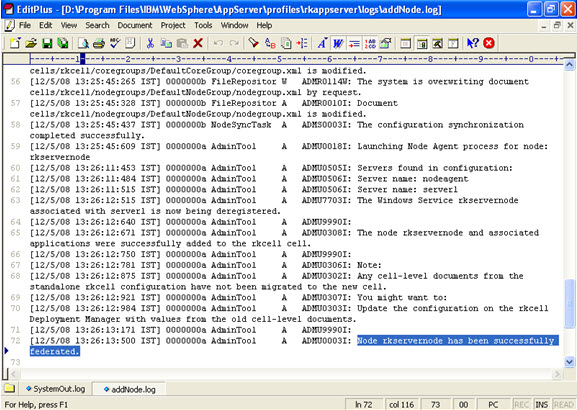
The addNode command incorporates a WebSphere Application Server installation into a cell. You must run this command from the install_root/bin directory of a WebSphere Application Server installation. Depending on the size and location of the new node you incorporate into the cell, this command can take a few minutes to complete.
- What does removeNode.sh do?
The removeNode command returns a node from a Network Deployment distributed administration cell to a base WebSphere Application Server installation.
The removeNode command only removes the node-specific configuration from the cell. This command does not uninstall any applications that were installed as the result of executing an addNode command. Such applications can subsequently deploy on additional servers in the Network Deployment cell. As a consequence, an addNode command with the -includeapps option executed after a removeNode command does not move the applications into the cell because they already exist from the first addNode command. The resulting application servers added on the node do not contain any applications. To deal with this situation, add the node and use the deployment manager to manage the applications. Add the applications to the servers on the node after it is incorporated into the cell.
The removeNode command does the following:
· Stops all of the running server processes in the node, including the node agent process.
· Removes the configuration documents for the node from the cell repository by sending commands to the deployment manager.
· Copies the original application server cell configuration into the active configuration.
- What does backupConfig.sh do?
Use the backupConfig utility to back up your WebSphere Application Server V5.0 node configuration to a file. By default, all servers on the node stop before the backup is made so that partially synchronized information is not saved. You can run this utility by issuing a command from the bin directory of a WebSphere Application Server installation or a network deployment installation.
- What does restoreConfig.sh do?
The restoreConfig command is a simple utility to restore the configuration of your node after backing up the configuration using the backupConfig command. By default, all servers on the node stop before the configuration restores so that a node synchronization does not occur during the restoration. If the configuration directory already exists, it will be renamed before the restoration occurs.
- What does WASPreUpgrade.sh do?
The WASPreUpgrade command is a migration tool that saves the configuration and applications of a previous version or release to a Version WebSphere Application Server node or Network Deployment node.
- What does WASPost Upgrade.sh do?
The WASPostUpgrade command is a migration tool for adding the configuration and applications of a previous version or release to the current WebSphere Application Server node. The configuration includes migrated applications. The tool adds all migrated applications into the install_root/installedApps directory of the current product. The tool locates the saved configuration that the WASPreUpgrade tool saves through a parameter you use to specify the backup directory.
A thread can be loosely defined as a separate stream of execution that takes place simultaneously with and independently of everything else that might be happening. A thread is like a classic program that starts at point A and executes until it reaches point B. It does not have an event loop. A thread runs independently of anything else happening in the computer. Without threads an entire program can be held up by one CPU intensive task or one infinite loop, intentional or otherwise. With threads the other tasks that don’t get stuck in the loop can continue processing without waiting for the stuck task to finish.
It turns out that implementing threading is harder than implementing multitasking in an operating system. The reason it’s relatively easy to implement multitasking is that individual programs are isolated from each other. Individual threads, however, are not.
The ability of an operating system to execute different parts of a program, called threads, simultaneously is called multithreading.
All naming operations are relative to a context. The initial context implements the Context interface and provides the starting point for resolution of names.
- What is Web Container thread pool size?
This value limits the number of requests that your application server can process concurrently.
- What are the algorithms used for Work Load Management?
WebSphere supports four specified load-balancing policies:
- Round robin
- Random
- Round robin prefer local
- Random prefer local.
As implied, the last two always select a stub that connects to a local clone, if one is available. The first two apply a round robin or random selection algorithm without consideration of the location of associated clone.
- How do we increase the JVM heap size?
1. In the administrative console Servers > Application Servers > server name > Process Definition > Java Virtual Machine.
2. It can also be increased in the startServer.sh file
- What are JNDI names and how are they related to the Application Server?
Java Naming and Directory Interface (JNDI) is a naming service that allows a program or container to register a “popular” name that is bound to an object. When a program wishes to lookup a name, it contacts the naming server, through a well-known port, and provides the public name, perhaps with authorization information. The naming server returns the object or, in some cases, a stub that can be used to interact with the object.
A JNDI server runs as part of the WebSphere environment. When the container is initiated, it loads the various applications deployed within it. Part of that process involves opening their respective EAR files and, in turn, their JAR files. For EJB container objects, such as entity and session EJBs, they are registered with the local JNDI server. Their public names are derived from their deployment descriptors or as a default value based on the class name. Once the EJB container is operational, the objects within it will be available through the associated JNDI server.
- What are maximum beans in a pool?
When an EJB has been in the free pool for the number of seconds specified in Idle Timeout, and the total number of beans in the free pool approaches the maximum beans in free pool specified in this field, idle beans are removed from the free pool.
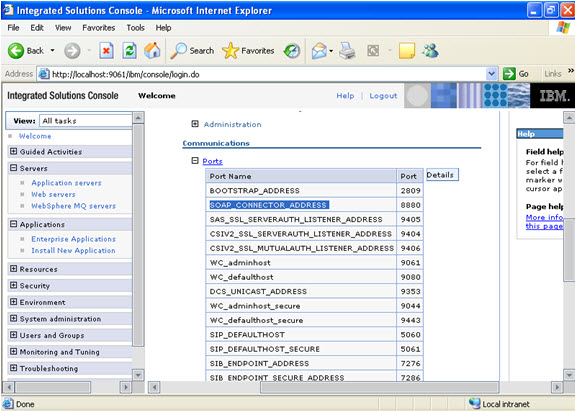
The console operation generates a cell-level plug-in configuration file containing entries for all application servers and clusters on all machines in the cell. he Web server plug-in is installed on the Web server machine, but the configuration file (plugin-cfg.xml) for the plug-in is generated via WebSphere and then moved to the appropriate location on the Web server.
- How do we debug and error if the customer complaints that he is not able to see the login page?
- Traceroute from the client to the server(Pinging the Web Server)
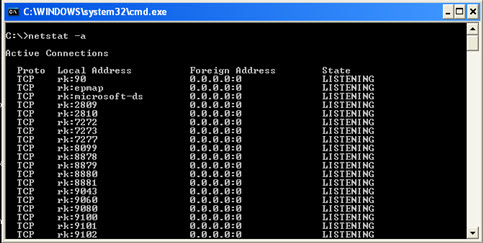
- Check for the system statistics(to which the particular request was sent, top, iostat,vmstat,netstat)
- Server logs(systemerr.log, activity.log)
- If logs do not show any info, take threaddump thrice within 5 minutes
- Heapdump (Use Heap Analser…Contains all the objects running in the JVM)
- What is a WebSphere Plugin?
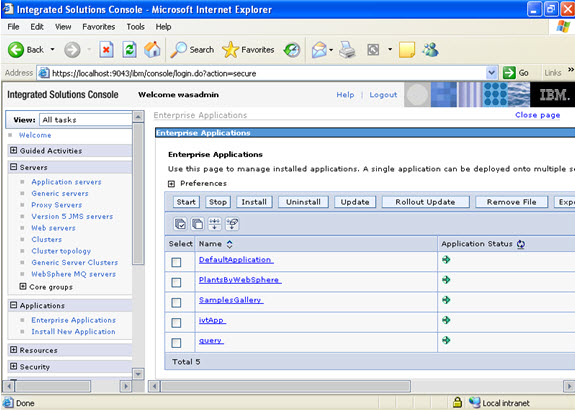
The WebSphere plug-in integrates with the HTTP Server and directs requests for WebSphere resources (servlets, JSPs, etc.) to the embedded HTTP server (see below). The WebSphere plug-in uses a configuration file called plugin-cfg.xml file to determine which requests are to be handled by WebSphere. As applications are deployed to the WebSphere configuration, this file must be regenerated (typically using the Administration Console) and distributed to all Web servers, so that they know which URL requests to direct to WebSphere. This is one of the few manual processes that a WebSphere administrator must do to maintain the WebSphere environment.
- Compare WAS 4.0 / 5.0 / 6.0 ?
Specialities of WAS 5.0 over 4.0
- Full J2EE 1.3 support and support for the Java SDK 1.3.1.
- A new administrative model based on the Java Management Extensions(JMX) framework and an XML-based configuration repository. A relational database is no longer required for the configuration repository.
- A Web-based administrative console provides a GUI interface for administration.
- An interface based on the Bean Scripting Framework, wsadmin, has been provided for administration through scripts. In V5, the only supported scripting language is JACL.
- Clustering, workload management, and single point of administration in a multi-node single cell topology
- SOAP/JMS support.
- Support for Jython scripting language support in wsadmin
- In a Network Deployment environment, the application server can now start without the Node Agent running.
Specialities of v6.0 over v5.0
J2EE 1.4 support
- WebSphere Application Server V6 provides full support for J2EE specification requires a certain set of specifications to be supported. These are EJB 2.1, JMS 1.1, JCA 1.5, Servlet 2.4, and JSP 2.0. WebSphere Application Server V6 also provides support for J2EE 1.2 and 1.3 to ease migration.
- Mixed cell support enables you to migrate an existing WebSphere Application Server V5 Network Deployment environment to V6. By migrating the Deployment Manager to V6 as a first step, you can continue to run V5 application servers until you can migrate each of them.
- Configuration archiving allows you to create a complete or partial archive of an existing WebSphere Application Server configuration. This archive is portable and can be used to create new configurations based on the archive.
- Defining a WebSphere Application Server V6 instance by a profile allows you to easily configure multiple runtimes with one set of install libraries. After installing the product, you create the runtime environment by building profiles.
- Defining a generic server as an application server instance in the administration tools allows you to associate it with a non-WebSphere server or process that is needed to support the application server environment.
- By defining external Web servers as managed servers, you can start and stop the Web server and automatically push the plug-in configuration to it. This requires a node agent to be installed on the machine and is typically used when the Web server is behind a firewall
- You can also define a Web server as an unmanaged server for placement outside the firewall. This allows you to create custom plug-ins for the Web server, but you must manually move the plug-in configuration to the Web server machine.
- As a special case, you can define the IBM HTTP server as an unmanaged server, but treat it as a managed server. This does not require a node agent because the commands are sent directly to the IBM HTTP server administration process.
- You can use node groups to define a boundary for server cluster formation. With WebSphere Application Server V6, you can now have nodes in cells with different capabilities, for example, a cell can contain both WebSphere Application Server on distributed systems and on z/OS. Node groups are created to group nodes of similar capability together to allow validation during system administration processes.
- The Tivoli Performance View monitor has also been integrated into the administrative console.
- Enhanced Enterprise Archive (EAR) files can now be built using Rational Application Developer or the Application Server Toolkit. The Enhanced EAR contains bindings and server configuration settings previously done at deployment time. This allows developers to predefine known runtime settings and can speed up deployment.
- Fine grain application update capabilities allow you to make small delta changes to applications without doing a full application update and restart.
- WebSphere Rapid Deployment provides the ability for developers to use annotation based programming. This is step forward in the automation of application development and deployment.
- Failover of stateful session EJBs is now possible. Each EJB container provides a method for stateful session beans to fail over to other servers. This feature uses the same memory to memory replication provided by the data replication services component used for HTTP session persistence.
- What if the thread is stuck?
You get to know if a thread is stuck by taking thread dump. If a thread is stuck, you should take the heap dump to know exactly at which object thread is stuck & let developer know about object creating problems.

 Tweet
Tweet
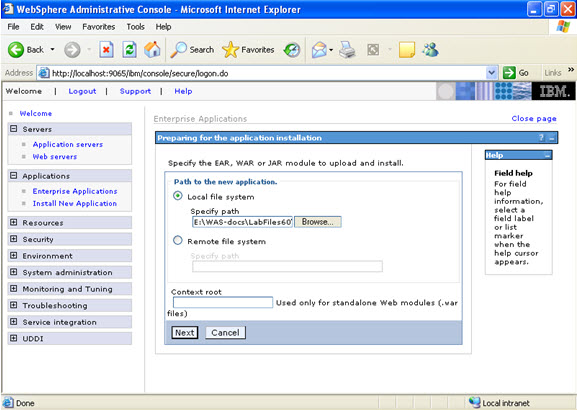
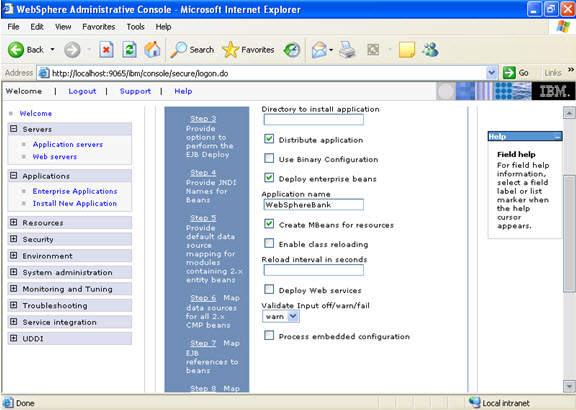
 Click on next.
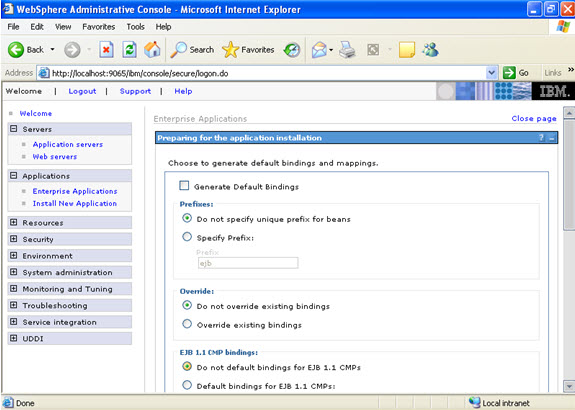
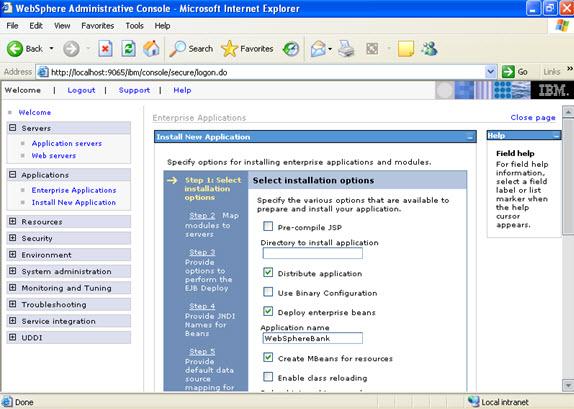
 Click on next. NOW, select the modules and select the application servers where you want to install the particular application so that the corresponding modules are installed on that particular servers.
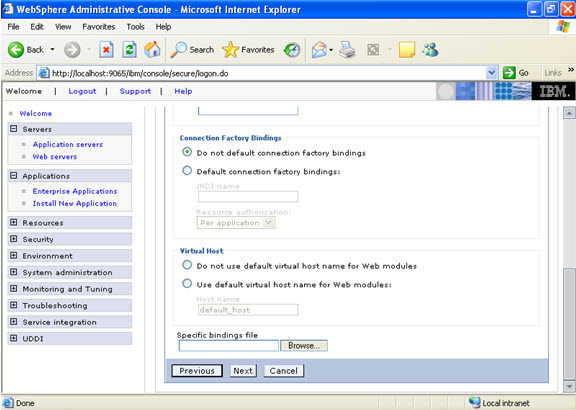
 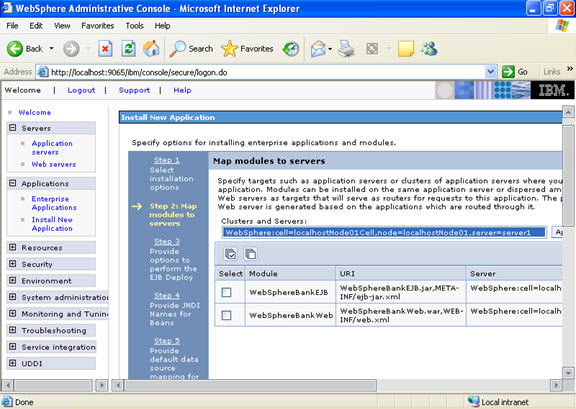 Click on next Now select the database that you want to use.
 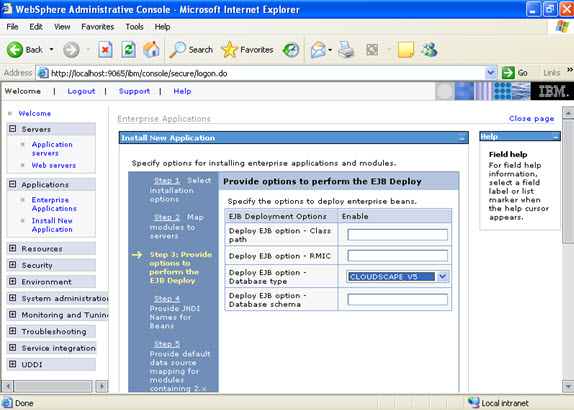 Step 4 Each none message driven bean in the application should be bound to the Java naming and directory interface.
 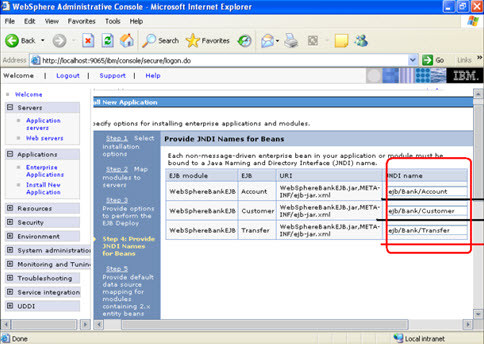 Step 5
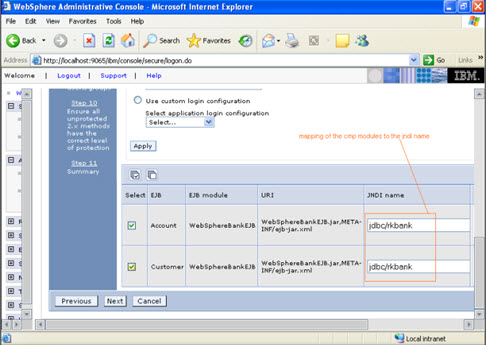
 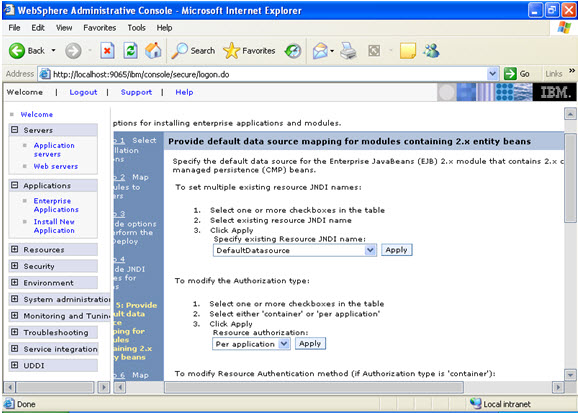 In the step 5 same screen only, You are mapping the modules to the entity beans. Now you have to specify the jndi name
 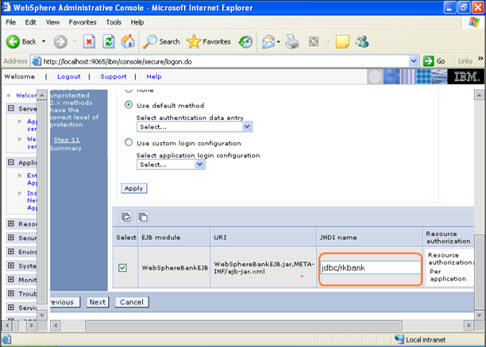 STEP 6 In this step, you have to map the modules to the cmp beans.
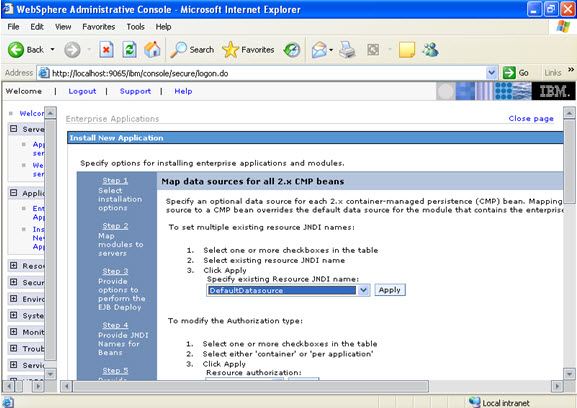
 Step 7
 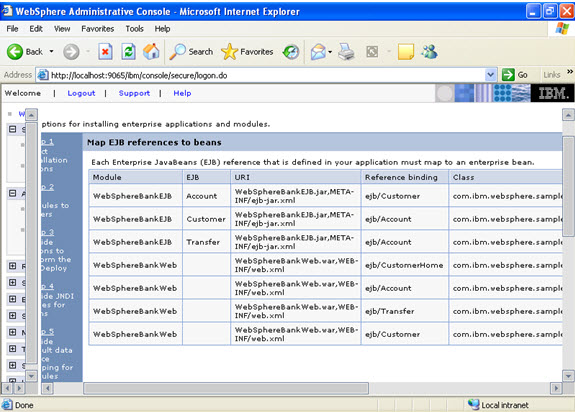 Step 8
  Step 9 Now there are two roles that were specified in the application. There is a tab to look up users. Now you can select the tab and loop up for the users and you can assign the particular users for that module.
 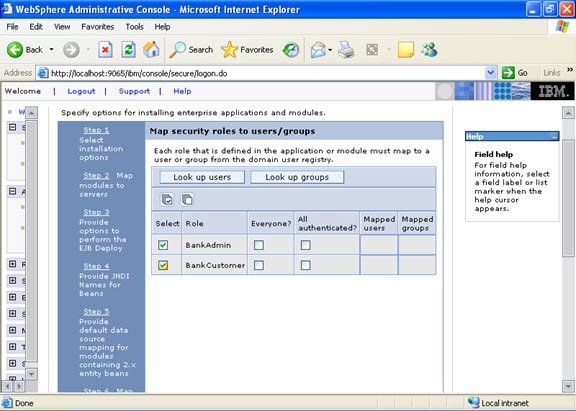 When you click on the tab for look up users: Here in my system there are no users, but it will show a list of users where you can select.
 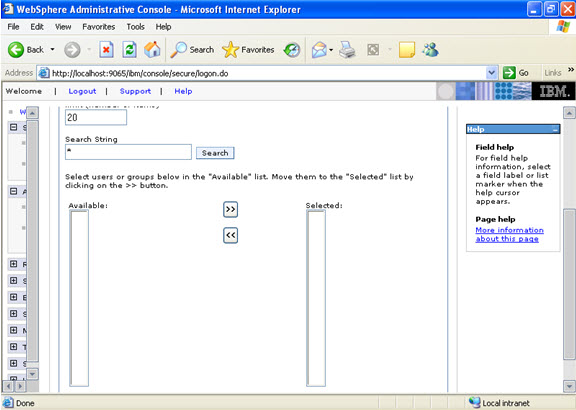 I have selected every one in the previous screen. Step 10 Select the role.
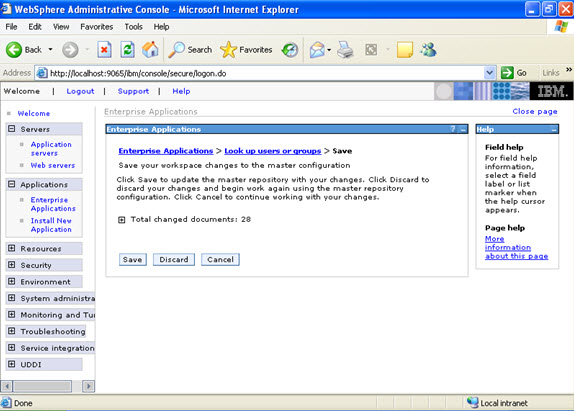
 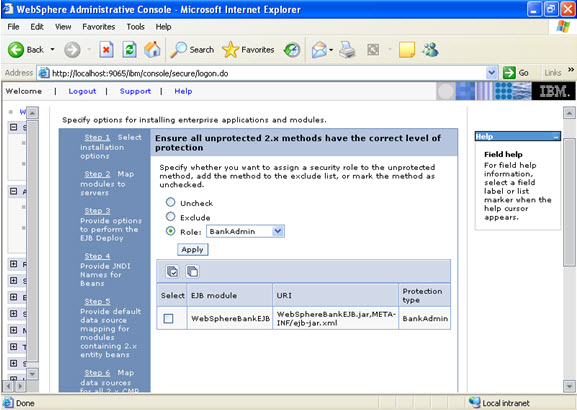 This is the summary of the settings that you have made.
 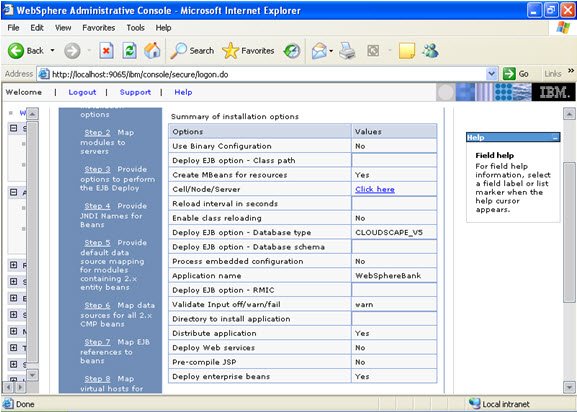 And click Finish.
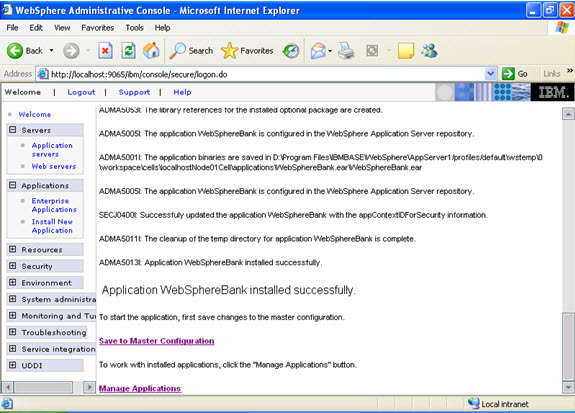
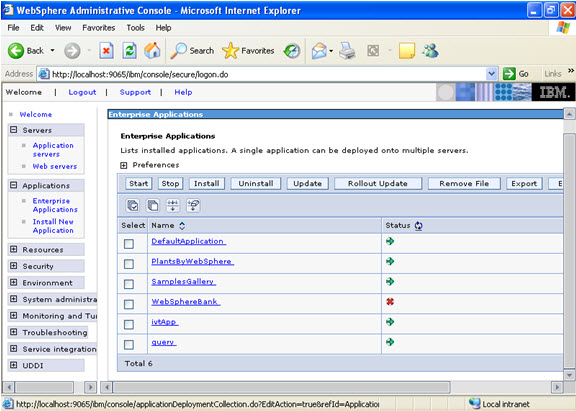 Now select the application and start.
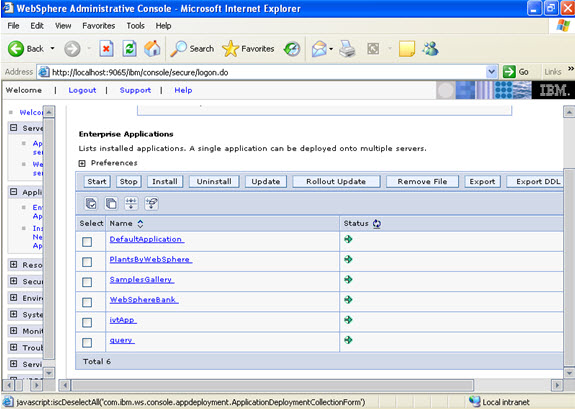
 Give the name:
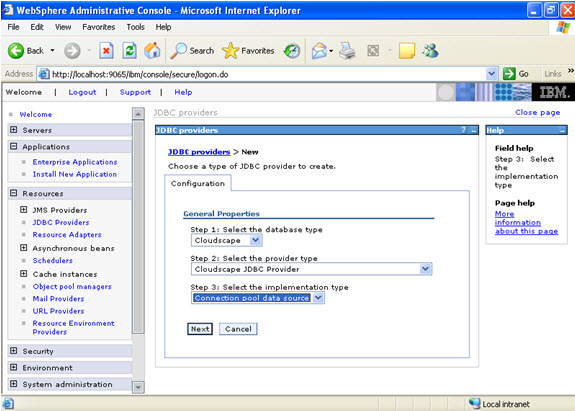
 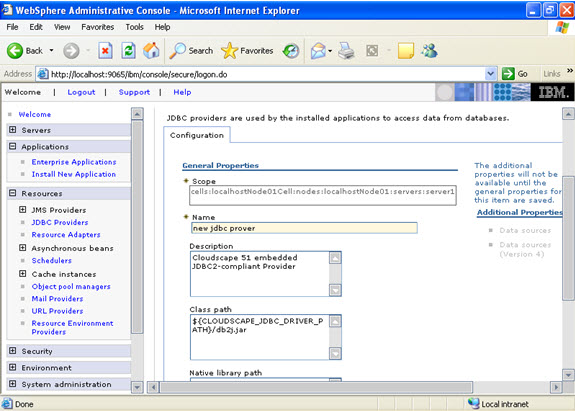 Select data sources -> new
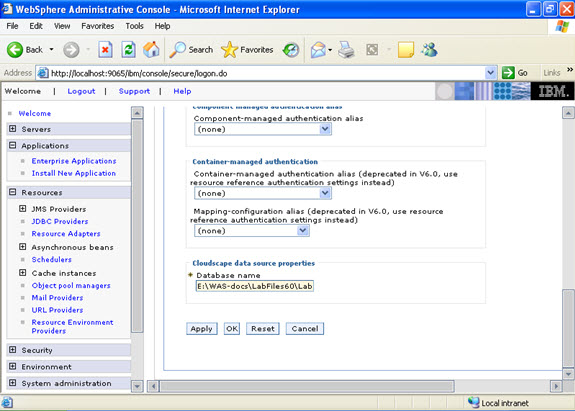
 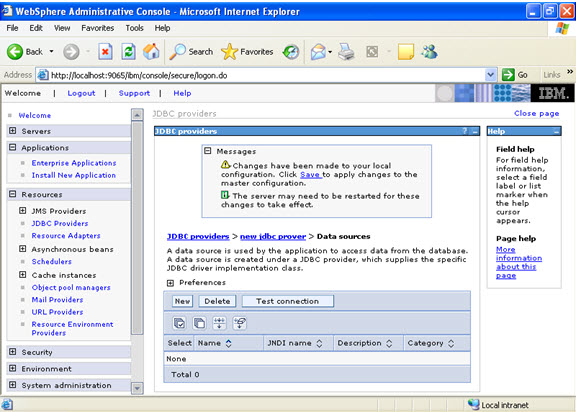 Click new, and provide the address of the database and name of the jndi.
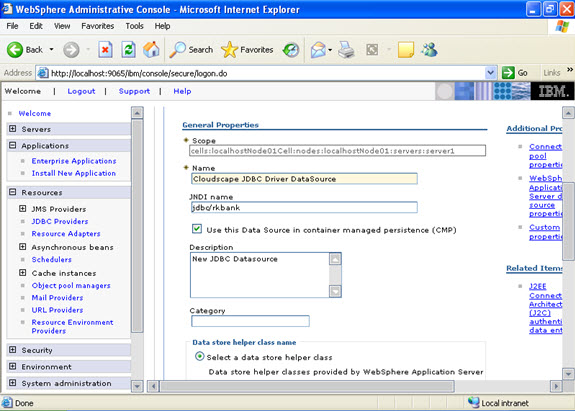


 How much of TAPE/Disk space have been used by backups