Websphere Hierarchy of Configuration Documents

Posted by Sagar Patil

Hierarchy of directories of documents

In a Network Deployment environment, changes made to configuration documents in the cell repository, are automatically replicated to the same configuration documents that are stored on nodes throughout the cell.

At the top of the hierarchy is the cells directory. It holds a subdirectory for each cell. The names of the cell subdirectories match the names of the cells. For example, a cell named cell1 has its configuration documents in the subdirectory cell1.

An example file structure is as follows:

  • Each cell subdirectory has the following files and subdirectories:
  • The cell.xml file provides configuration data for the cell.Files such as security.xml, virtualhosts.xml, resources.xml, and variables.xml provide configuration data that applies across every node in the cell
  • Each cluster subdirectory holds a cluster.xml file, which provides configuration data specifically for that cluster.
  • The nodes subdirectory holds a subdirectory for each node in the cell.
    The names of the nodes subdirectories match the names of the nodes.Each node subdirectory holds files such as variables.xml and resources.xml, which provide configuration data that applies across the node.
  • Each server subdirectory holds a server.xml file, which provides configuration data specific to that server.
    Server subdirectories might hold files such as security.xml, resources.xml and variables.xml, which provide configuration data that applies only to the server. The configurations specified in these server documents override the configurations specified in containing cell and node documents having the same name.
  • The applications subdirectory, holds a subdirectory for each application deployed in the cell.
    The names of the applications subdirectories match the names of the deployed applications.Each deployed application subdirectory holds a deployment.xml file that contains configuration data on the application deployment. Each subdirectory also holds a META-INF subdirectory that holds a Java 2 Platform, Enterprise Edition (J2EE) application deployment descriptor file as well as IBM deployment extensions files and bindings files. Deployed application subdirectories also hold subdirectories for all .war and entity bean .jar files in the application. Binary files such as .jar files are also part of the configuration structure.
cells
  cell1
     cell.xml resources.xml virtualhosts.xml variables.xml security.xml
     nodes
        nodeX
           node.xml variables.xml resources.xml serverindex.xml
           serverA
              server.xml variables.xml
           nodeAgent
              server.xml variables.xml
        nodeY
           node.xml variables.xml resources.xml serverindex.xml
     applications
        sampleApp1
           deployment.xml
           META-INF
              application.xml ibm-application-ext.xml ibm-application-bnd.xml
        sampleApp2
           deployment.xml
           META-INF
              application.xml ibm-application-ext.xml ibm-application-bnd.xml


WebSphere Configuration Files

Posted by Sagar Patil

Application server configuration files define the available application servers, their configurations, and their contents.

A configuration repository stores configuration data.  Configuration repositories reside in the config subdirectory of the profile root directory.

A cell-level repository stores configuration data for the entire cell and is managed by a file repository service that runs in the deployment manager.

The deployment manager and each node have their own repositories. A node-level repository stores configuration data that is needed by processes on that node and is accessed by the node agent and application servers on that node.

The master repository is comprised of following .xml configuration files

Configuration file Locations Purpose Manual editing required
admin-authz.xml
config/cells/
cell_name/
Define a role for administrative operation authorization.
app.policy
config/cells/
cell_name/
nodes/node_name/
Define security permissions for application code. X
cell.xml
config/cells/
cell_name/
Identify a cell.
cluster.xml
config/cells/
cell_name/
clusters/
cluster_name/
Identify a cluster and its members and weights.This file is only available with the Network Deployment product.
deployment.xml
config/cells/
cell_name/
applications/
application_name/
Configure application deployment settings such as target servers and application-specific server configuration.
filter.policy
config/cells/
cell_name/
Specify security permissions to be filtered out of other policy files. X
integral-jms-authorizations.xml
config/cells/
cell_name/
Provide security configuration data for the integrated messaging system. X
library.policy
config/cells/
cell_name/
nodes/node_name/
Define security permissions for shared library code. X
multibroker.xml
config/cells/
cell_name/
Configure a data replication message broker.
namestore.xml
config/cells/
cell_name/
Provide persistent name binding data. X
naming-authz.xml
config/cells/
cell_name/
Define roles for a naming operation authorization. X
node.xml
config/cells/
cell_name/
nodes/node_name/
Identify a node.
pmirm.xml
config/cells/
cell_name/
Configure PMI request metrics X
resources.xml
config/cells/
cell_name/
config/cells/
cell_name/
nodes/node_name/

config/cells/
cell_name/
nodes/node_name/
servers/
server_name/

Define operating environment resources, including JDBC, JMS, JavaMail, URL, JCA resource providers and factories.
security.xml
config/cells/
cell_name/
Configure security, including all user ID and password data.
server.xml
config/cells/
cell_name/
nodes/
node_name/
servers/
server_name/
Identify a server and its components.
serverindex.xml
config/cells/
cell_name/
nodes/
node_name/
Specify communication ports used on a specific node.
spi.policy
config/cells/
cell_name/
nodes/
node_name/
Define security permissions for service provider libraries such as resource providers. X
variables.xml
config/cells/
cell_name/
config/cells/
cell_name/
nodes/
node_name/
 config/cells/
cell_name/
nodes/node_name/
servers/
server_name/
Configure variables used to parameterize any part of the configuration settings.
virtualhosts.xml
config/cells/
cell_name/
Configure a virtual host and its MIME types.

You can edit configuration files using the administrative console, scripting, wsadmin commands, programming, or by editing a configuration file directly.

Administrating WebSphere : Start/Stop/Status, Kill Sessions

Posted by Sagar Patil

Check Server Status:

$WAS_HOME/profiles/Profile01/Node01/bin/serverStatus  server1(JVM NAME)
serverStatus -all (returns status for all defined servers)
serverStatus -trace (produces the serverStatus.log file)

Stop WebSphere :

ps -eaf | grep java
i.e. Dmgr ,nodeagent, prod_server_member2,prod_server_member4

sudo -u %was_user% -i
cd /opt/IBM/WebSphere/AppServer/profiles/Profile01/Nodes/bin
./stopServer.sh prod_server_member2
./stopServer.sh prod_server_member4
./stopNode.sh

cd /opt/IBM/WebSphere/AppServer/profiles/Profile01/Dmgr/bin
./stopServer.sh Dmgr

Start WebSphere : Check to see if java processes do not exist

cd /opt/IBM/WebSphere/AppServer/profiles/Profile01/Dmgr/bin
./startServer.sh Dmgr

cd /opt/IBM/WebSphere/AppServer/profiles/Profile01/Nodes/bin
./startNode.sh
./startServer.sh prod_server_member2
./startServer.sh prod_server_member4

ps -eaf | grep java (check to see if java processes do not exist)
i.e. Dmgr, nodeagent, prod_server_member2, prod_server_member4

To get just pid for killing processes use $ ps -ef | grep java | grep dev_server_member2 | awk ‘{print $2}’
8867
8880

Using apachectl commands to start IBM HTTP Server

$sudo -u was61 -i
/opt/IBM/HTTPServer/bin/apachectl start
/opt/IBM/HTTPServer/bin/apachectl stop

$sudo /opt/IBM/HTTPServer/bin/apachectl start

To list all the jvm process that websphere is running..

1. ps-ef | grep <path to websphere java>
ps -ef | grep /<was_root>/java
wasadm 18445 18436 0 13:48:33 pts/9 0:00 grep <was_root>/java
wasadm 9959 1 0 Feb 18 ? 4:17 <was_root>/java/bin/java -XX:MaxPermSize=256m -Dwas.status.socket=49743 -X
wasadm 9927 1 0 Feb 18 ? 5:10 <was_root>/java/bin/java -XX:MaxPermSize=256m -Dwas.status.socket=49611 -X

2. pgrep -f -u $WASUSER $ENVPATH

Log File locations

Httpd Logs : /opt/IBM/HTTPServer/logs

WAS logs :
[was61@bin]$ ls -l $WAS_HOME/profiles/Profile01/Node01/logs
total 2092
-rw-r–r– 1 was61 web 2097152 Jan 12 10:28 activity.log
drwxr-xr-x 2 was61 web    4096 Jan 12 09:55 dev_server_member1
drwxr-xr-x 2 was61 web    4096 Jan 11 16:20 dev_server_member2
drwxr-xr-x 2 was61 web   28672 Jan 12 10:10 ffdc
drwxr-xr-x 2 was61 web    4096 Jan  8 16:31 nodeagent

$WAS_HOME/profiles/Profile01/Node01/logs/nodeagent/:
total 1116
-rw-r–r– 1 was61 web      83 Jan 11 16:57 monitor.state
-rw-r–r– 1 was61 web   11534 Jan 11 16:57 native_stderr.log
-rw-r–r– 1 was61 web   11400 Jan  8 16:31 native_stdout.log
-rw-r–r– 1 was61 web       0 Jan  8 16:31 nodeagent.pid
-rw-r–r– 1 was61 web   12288 Jan  8 16:31 startServer.log
-rw-r–r– 1 was61 web   15491 Jan  8 16:24 stopServer.log
-rw-r–r– 1 was61 web   11400 Jan  8 16:31 SystemErr.log
-rw-r–r– 1 was61 web 1048525 Jan  8 15:26 SystemOut_10.01.08_15.27.29.log
-rw-r–r– 1 was61 web   17125 Jan 11 16:57 SystemOut.log

ASM ftp/http Access

Posted by Sagar Patil

XDB enable use of FTP and HTML protocols to access and manage files located on ASM disksgroups. Files can be easily browse or moved in/out from ASM this way.

To set up the FTP access, We must first set up the Oracle XML DB access to the ASM folders. We can do this by executing the catxdbdbca.sql script, found in the $ORACLE_HOME/rdbms/admin directory. The script takes two parameters: the port numbers for the FTP and HTTP services, respectively. So I run the script as follows:

Sqlplus>connect sys/oracle @catxdbdbca 7787 8080

Running the script enables an FTP service listening on port 7787 and an HTTP service on port 8080. If you look at your listener status it should display the 2 new ports.

LSNRCTL> status
Connecting to (DESCRIPTION=(ADDRESS=(PROTOCOL=TCP)(HOST=localhost)(PORT=1521)))
STATUS of the LISTENER
————————
Alias listener
Version TNSLSNR for Linux: Version 10.2.0.1.0 – Production
Start Date 05-AUG-2009 17:44:48
Uptime 140 days 21 hr. 2 min. 48 sec
Trace Level off
Security ON: Local OS Authentication
SNMP OFF
Listener Parameter File /u01/app/oracle/product/10.2.0/db_1/network/admin/listener.ora
Listener Log File /u01/app/oracle/product/10.2.0/db_1/network/log/listener.log
Listening Endpoints Summary…
(DESCRIPTION=(ADDRESS=(PROTOCOL=tcp)(HOST=localhost)(PORT=1521)))
(DESCRIPTION=(ADDRESS=(PROTOCOL=ipc)(KEY=EXTPROC)))
(DESCRIPTION=(ADDRESS=(PROTOCOL=tcp)(HOST=localhost)(PORT=7787))(Presentation=FTP)(Session=RAW))
(DESCRIPTION=(ADDRESS=(PROTOCOL=tcp)(HOST=localhost)(PORT=8080))(Presentation=HTTP)(Session=RAW))

Use FTP to access ASM files : We can access the ASM folders from an external source, using a regular FTP client like filezilla.

ftp> open localhost 7787
Connected to localhost
Unauthorised use of this FTP server is prohibited and may be subject to civil and criminal prosecution.
220 wygtstorlocalhost FTP Server (Oracle XML DB/Oracle Database) ready.
530 Please login with USER and PASS.
KERBEROS_V4 rejected as an authentication type
Name (localhost:oracle): system
331 pass required for SYSTEM
Password:
230 SYSTEM logged in
Remote system type is Unix.
ftp> cd /sys/asm : ASM volumes stored here
250 CWD Command successful
ftp> ls
200 PORT Command successful
150 ASCII Data Connection
DATA
BACKUP
ftp: 21 bytes received in 0.48Seconds 0.04Kbytes/sec.

Use HTTP to access ASM files : Let’s use a browser to access asm files

My servername is localhost so I have to use URL http://localhost:8080. I entered oracle system user and password at credentials. The next screen shows the list of directories

Duplicating an ASM Database at Remote Host

Posted by Sagar Patil

You can use the create RMAN DUPLICATE command to duplicate database from target database backups while still retaining the original target database. The duplicate database can be either identical to the original database or contain only a subset of the original tablespaces. A duplicate database is a copy of the target database that you can run independently for a variety of purposes.

Read more…

Oracle 10g script for User/Role/Object Privileges

Posted by Sagar Patil

Imagine you have to drop an Oracle user and create it with all privs/roles again.  This often happens in test cycle of 3rd party products. The privs are sent to user on ad hoc basis to get around the installation errors and then comes requirement to replicate it on another server.  How do you do it?  Attached script will create a spool file for user granted roles, object Privileges

set serveroutput on
set feedback off
set verify off
declare
test varchar2(10000);
h number;
j number := 0;
begin
dbms_output.enable(10000);
–prompt enter the user name accept user
dbms_output.put_line(‘***********************************************************************’);
dbms_output.put_line(‘The Roles granted to the users are ‘);
dbms_output.put_line(‘***********************************************************************’);
select DBMS_METADATA.GET_GRANTED_DDL(‘ROLE_GRANT’,upper(‘&&USER’)) into test from dual;
for i in 1..ceil(length(test)/255)
loop
dbms_output.put_line(substr(test,j,255));
j := j+255;
end loop;
dbms_output.put_line(‘***********************************************************************’);
j := 0;
dbms_output.put_line(‘The System privileges are ‘);
dbms_output.put_line(‘***********************************************************************’);
select DBMS_METADATA.GET_GRANTED_DDL(‘SYSTEM_GRANT’,upper(‘&&USER’)) into test from dual;
for i in 1..ceil(length(test)/255)
loop
dbms_output.put_line(substr(test,j,255));
j := j+255;
end loop;
dbms_output.put_line(‘************************************************************************’);
j := 0;
dbms_output.put_line(‘The Object level privileges are ‘);
dbms_output.put_line(‘***********************************************************************’);
select DBMS_METADATA.GET_GRANTED_DDL(‘OBJECT_GRANT’,upper(‘&&USER’)) into test from dual;
for i in 1..ceil(length(test)/255)
loop
dbms_output.put_line(substr(test,j,255));
j := j+255;
end loop;
dbms_output.put_line(‘*************************************************************************’);
end;


Sample OUTPUT produced

Enter value for user: SYSTEM
***********************************************************************
The Roles granted to the users are
***********************************************************************
GRANT “DBA” TO “SYSTEM” WITH ADMIN OPTION
GRANT “AQ_ADMINISTRATOR_ROLE” TO “SYSTEM” WITH ADMIN OPTION
GRANT “MGMT_USER” TO “SYSTEM”

***********************************************************************
The System privileges are
***********************************************************************
GRANT GLOBAL QUERY REWRITE TO “SYSTEM”
GRANT CREATE MATERIALIZED VIEW TO “SYSTEM”
GRANT SELECT ANY TABLE TO “SYSTEM”
GRANT CREATE TABLE TO “SYSTEM”
GRANT UNLIMITED TABLESPACE TO”SYSTEM” WITH ADMIN OPTION

************************************************************************
The Object level privileges are
***********************************************************************
GRANT ALTER ON “SYS”.”INCEXP” TO “SYSTEM”
GRANT DELETE ON “SYS”.”INCEXP” TO “SYSTEM”
GRANT INDEX ON “SYS”.”INCEXP” TO “SYSTEM”
GRANT INSERT ON “SYS”.”INCEXP” TO “SYSTEM”
GRANT SELECT ON “SYS”.”INCEXP” TO “SYSTEM”
GRANT UPDATE ON “SYS”.”INCEXP” TO “SYSTEM”
GRANT REFERENCES ON “SYS”.”INCEXP” TO “SYSTEM”
GRANT ON COMMIT REFRESH ON “SYS”.”INCEXP” TO “SYSTEM”
GRANT QUERY REWRITE ON “SYS”.”INCEXP” TO “SYSTEM”
GRANT DEBUG ON “SYS”.”INCEXP” TO “SYSTEM”
GRANT FLASHBACK ON “SYS”.”INCEXP” TO “SYSTEM”
GRANT ALTER ON “SYS”.”INCVID” TO “SYSTEM”
GRANT DELETE ON”SYS”.”INCVID” TO “SYSTEM”
GRANT INDEX ON “SYS”.”INCVID” TO “SYSTEM”
GRANT INSERT ON”SYS”.”INCVID” TO “SYSTEM”
GRANT SELECT ON “SYS”.”INCVID” TO “SYSTEM”
GRANT UPDATE ON “SYS”.”INCVID” TO “SYSTEM”
GRANT REFERENCES ON “SYS”.”INCVID” TO “SYSTEM”
GRANT ON COMMIT REFRESH ON “SYS”.”INCVID” TO “SYSTEM”
GRANT QUERY REWRITE ON “SYS”.”INCVID” TO “SYSTEM”
GRANT DEBUG ON “SYS”.”INCVID” TO “SYSTEM”
GRANT FLASHBACK ON “SYS”.”INCVID” TO “SYSTEM”
GRANT ALTER ON “SYS”.”INCFIL” TO”SYSTEM”
GRANT DELETE ON “SYS”.”INCFIL” TO “SYSTEM”
GRANT INDEX ON “SYS”.”INCFIL” TO “SYSTEM”
GRANT INSERT ON “SYS”.”INCFIL” TO “SYSTEM”
GRANT SELECT ON “SYS”.”INCFIL” TO “SYSTEM”
GRANT UPDATE ON “SYS”.”INCFIL” TO “SYSTEM”
GRANT REFERENCES ON “SYS”.”INCFIL” TO “SYSTEM”
GRANT ON COMMIT REFRESH ON “SYS”.”INCFIL” TO “SYSTEM”
GRANT QUERY REWRITE ON “SYS”.”INCFIL” TO “SYSTEM”
GRANT DEBUG ON “SYS”.”INCFIL” TO “SYSTEM”
GRANT FLASHBACK ON “SYS”.”INCFIL” TO “SYSTEM”
GRANT EXECUTE ON “SYS”.”DBMS_ALERT” TO “SYSTEM”
GRANT EXECUTE ON “SYS”.”DBMS_SYS_ERROR” TO “SYSTEM”
GRANT EXECUTE ON “SYS”.”DBMS_RULE_EXIMP” TO “SYSTEM” WITH GRANT OPTION
GRANT EXECUTE ON “SYS”.”DBMS_AQ” TO “SYSTEM” WITH GRANT OPTION
GRANT EXECUTE ON “SYS”.”DBMS_AQADM” TO “SYSTEM” WITH GRANT OPTION
GRANT EXECUTE ON “SYS”.”DBMS_AQ_IMPORT_INTERNAL” TO “SYSTEM” WITH GRANT OPTION
GRANT EXECUTE ON “SYS”.”DBMS_AQELM” TO “SYSTEM” WITH GRANT OPTION
GRANT EXECUTE ON “SYS”.”DBMS_TRANSFORM_EXIMP” TO “SYSTEM” WITH GRANT OPTION
GRANT EXECUTE ON “SYS”.”SYS_GROUP” TO “SYSTEM”
GRANT EXECUTE ON “SYS”.”DBMS_DEFER_IMPORT_INTERNAL” TO “SYSTEM”
GRANT EXECUTE ON “SYS”.”DBMS_REPCAT” TO “SYSTEM”
GRANT EXECUTE ON “SYS”.”SET_TABLESPACE” TO”SYSTEM”
GRANT EXECUTE ON “SYS”.”CHECK_UPGRADE” TO “SYSTEM”
*************************************************************************

Database hanging due to TX-Transaction (row lock contention)

Posted by Sagar Patil

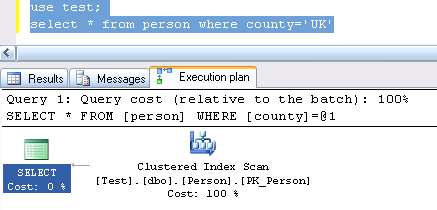
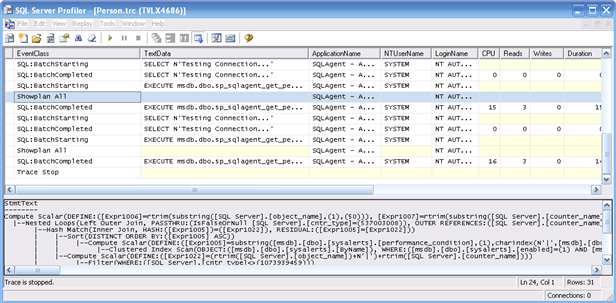
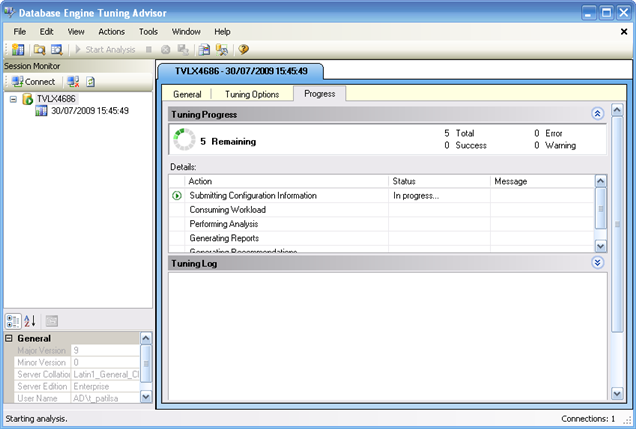
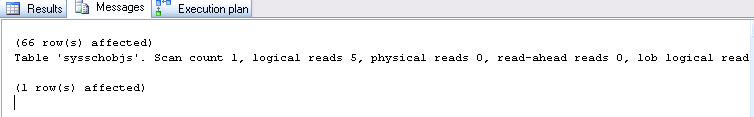
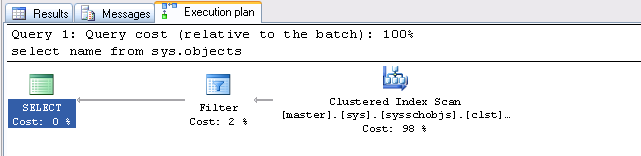
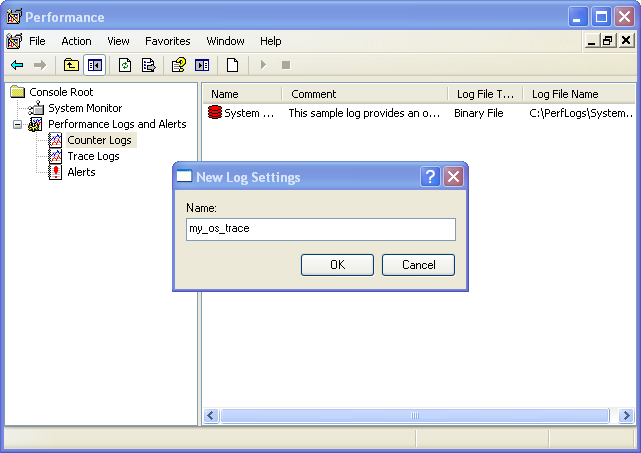
My Statspack has following details.

Enqueue activity DB/Inst: Snaps: 1791-1808
-> only enqueues with waits are shown
-> Enqueue stats gathered prior to 10g should not be compared with 10g data
-> ordered by Wait Time desc, Waits desc

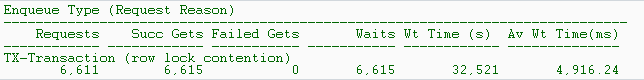
Above list indicates oracle was waiting about 4 secs to acquire a lock. Let’s look at row contention and enqueues closely.

I was looking on google and stumbled across exceptional article “Diagnose performance problems, using the wait interface in Oracle 10g.”
John, the DBA at Acme Bank, is on the phone with an irate user, Bill, who complains that his database session is hanging, a complaint not unfamiliar to most DBAs. What can John do to address Bill’s complaint?
Acme Bank’s database is Oracle Database 10g, so John has many options. Automatic Database Diagnostic Manager (ADDM), new in Oracle Database 10g, can tell John about the current overall status and performance of the database, so John starts with ADDM to determine whether what Bill’s session is experiencing is the result of a databasewide issue. The ADDM report identifies no databasewide issues that could have this impact on Bill’s session, so John moves on to the next option.

One way to diagnose session-level events such as Bill’s is to determine whether the session is waiting for anything, such as the reading of a block of a file, a lock on a table row, or a latch. Oracle has provided mechanisms to display the waits happening inside the database since Oracle7, and during the last several years, the model has been steadily perfected, with more and more diagnostic information added to it. In Oracle Database 10g, which makes significantly improved wait event information available, diagnosing a session slowdown has become even easier. This article shows you how to use the wait events in Oracle Database 10g to identify bottlenecks.

Session Waits : How can John the DBA determine what’s causing Bill’s session to hang? Actually, the session is not hanging; it’s waiting for an event to happen, and that’s exactly what John checks for.

To continue his investigation, John could use Oracle Enterprise Manager or he could directly access V$ views from the command line. John has a set of scripts he uses to diagnose these types of problems, so he uses the command line.

John queries the V$SESSION view to see what Bill’s session is waiting for. (Note that John filters out all idle events.)

select sid, username, event, blocking_session,
seconds_in_wait, wait_time
from v$session where state in (‘WAITING’)
and wait_class != ‘Idle’;

The output follows, in vertical format.
SID : 270
USERNAME : BILL
EVENT : enq: TX – row lock
contention
BLOCKING_SESSION : 254
SECONDS_IN_WAIT : 83
WAIT_TIME : 0

Looking at this information, John immediately concludes that Bill’s session with SID 270 is waiting for a lock on a table and that that lock is held by session 254 (BLOCKING_SESSION).

But John wants to know which SQL statement is causing this lock. He can find out easily, by issuing the following query joining the V$SESSION and V$SQL views:

select sid, sql_text
from v$session s, v$sql q
where sid in (254,270)
and (
q.sql_id = s.sql_id or
q.sql_id = s.prev_sql_id);

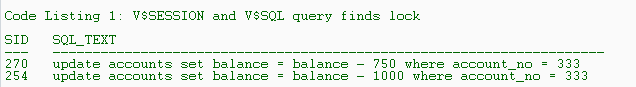
Listing 1 shows the result of the query. And there (in Listing 1) John sees it?both sessions are trying to update the same row. Unless session 254 commits or rolls back, session 270 will continue to wait for the lock. He explains this to Bill, who, considerably less irate now, decides that something in the application has gone awry and asks John to kill session 254 and release the locks.

Wait Classes After John kills the blocking session, Bill’s session continues but is very slow. John decides to check for other problems in the session. Again, he checks for any other wait events, but this time he specifically checks Bill’s session.

In Oracle Database 10g, wait events are divided into various wait classes, based on their type. The grouping of events lets you focus on specific classes and exclude nonessential ones such as idle events. John issues the following against the V$SESSION_WAIT_CLASS view:

select wait_class_id, wait_class,
total_waits, time_waited
from v$session_wait_class
where sid = 270;

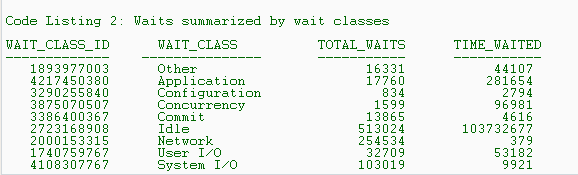
The output, shown in Listing 2, shows the wait classes and how many times the session has waited for events in each class. It tells John that application-related waits such as those due to row locks have occurred 17,760 times, for a total of 281,654 centiseconds (cs)?hundredths of a second?since the instance started. John thinks that this TIME_WAITED value is high for this session. He decides to explore the cause of these waits in the application wait class. The times for individual waits are available in the V$SYSTEM_EVENT view. He issues the following query to identify individual waits in the application wait class (class id 4217450380):

select event, total_waits, time_waited
from v$system_event e, v$event_name n
where n.event_id = e.event_id
and wait_class_id = 4217450380;

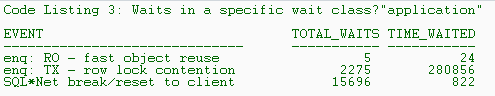
Listing 3 shows the output of this query. It shows that lock contentions (indicated by the event enq: TX – row lock contention) constitute the major part of the waiting time in the application wait class. This concerns John. Is it possible that a badly written application made its way through to the production database, causing these lock contention problems?

Being the experienced DBA that he is, however, John does not immediately draw that conclusion. The data in Listing 3 merely indicates that the users have experienced lock-contention-related waits a total of 2,275 times, for 280,856 cs. It is possible that mostly 1- or 2-cs waits and only one large wait account for the total wait time, and in that case, the application isn’t faulty. A single large wait may be some freak occurrence skewing the data and not representative of the workload on the system. How can John determine whether a single wait is skewing the data?

Oracle 10g provides a new view, V$EVENT_HISTOGRAM, that shows the wait time periods and how often sessions have waited for a specific time period. He issues the following against V$EVENT_HISTOGRAM:

select wait_time_milli bucket, wait_count
from v$event_histogram
where event =
‘enq: TX – row lock contention’;
The output looks like this:

BUCKET WAIT_COUNT
———– ———-
1 252
2 0
4 0
8 0
16 1
32 0
64 4
128 52
256 706
512 392
1024 18
2048 7
4096 843

The V$EVENT_HISTOGRAM view shows the buckets of wait times and how many times the sessions waited for a particular event?in this case, a row lock contention?for that duration. For example, sessions waited 252 times for less than 1 millisecond (ms), once less than 16
ms but more than 1 ms, and so on. The sum of the values of the WAIT_COUNT column is 2,275, the same as the value shown in the event enq: TX – row lock contention, shown in Listing 3. The V$EVENT_HISTOGRAM view shows that the most waits occurred in the ranges of 256 ms, 512 ms, and 4,096 ms, which is sufficient evidence that the applications are experiencing locking issues and that this locking is the cause of the slowness in Bill’s session. Had the view showed numerous waits in the 1-ms range, John wouldn’t have been as concerned, because the waits would have seemed normal.

Time Models : Just after John explains his preliminary findings to Bill, Lora walks in with a similar complaint: Her session SID 355 is very slow. Once again, John looks for the events the session is waiting for, by issuing the following query against the V$SESSION_WAIT view:

select event, seconds_in_wait,
wait_time
from v$session_wait
where sid = 355;

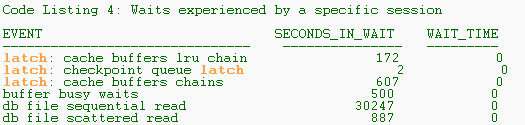
The output, shown in Listing 4, shows a variety of wait events in Lora’s session, including latch contention, which may be indicative of an application design problem. But before he sends Lora off with a prescription for an application change, John must support his theory that bad application design is the cause of the poor performance in Lora’s session. To test this theory, he decides to determine whether the resource utilization of Lora’s session is extraordinarily high and whether it slows not only itself but other sessions too.

In the Time Model interface of Oracle Database 10g, John can easily view details of time spent by a session in various activities. He issues the following against the V$SESS_TIME_MODEL view:

select stat_name, value
from v$sess_time_model
where sid = 355;

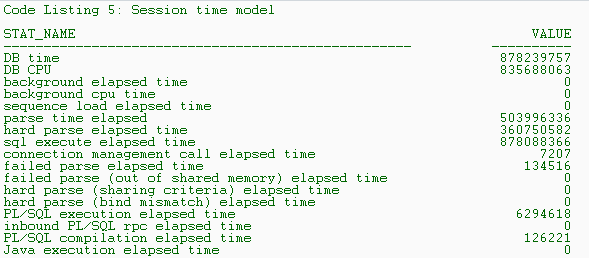
The output, shown in Listing 5, displays the time (in microseconds) spent by the session in various places. From this output, John sees that the session spent 503,996,336 microseconds parsing (parse time elapsed), out of a total of 878,088,366 microseconds on all SQL execution (sql execute elapsed time), or 57 percent of the SQL execution time, which indicates that a cause of this slowness is high parsing. John gives Lora this information, and she follows up with the application design team.

OS Statistics :While going over users’ performance problems, John also wants to rule out the possibility of the host system’s being a bottleneck. Before Oracle 10g, he could use operating system (OS) utilities such as sar and vmstat and extrapolate the metrics to determine contention. In Oracle 10g, the metrics at the OS level are collected automatically in the database. To see potential host contention, John issues the following query against the V$OSSTAT view:

select * from v$osstat;

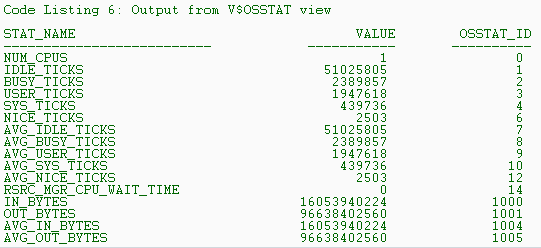
The output in Listing 6 shows the various elements of the OS-level metrics collected. All time elements are in cs. From the results in Listing 6, John sees that the single CPU of the system has been idle for 51,025,805 cs (IDLE_TICKS) and busy for 2,389,857 cs (BUSY_TICKS), indicating a CPU that is about 4 percent busy. From this he concludes that the CPU is not a bottleneck on this host. Note that if the host system had more than one CPU, the columns whose headings had the prefix AVG_, such as AVG_IDLE_TICKS, would show the average of these metrics over all the CPUs.

Active Session History: So far the users have consulted John exactly when each problem occurred, enabling him to peek into the performance views in real time. This good fortune doesn’t last long?Janice comes to John complaining about a recent performance problem. When John queries the V$SESSION view, the session is idle, with no events being waited for. How can John check which events Janice’s session was waiting for when the problem occurred?

Oracle 10g collects the information on active sessions in a memory buffer every second. This buffer, called Active Session History (ASH), which can be viewed in the V$ACTIVE_SESSION_HISTORY dynamic performance view, holds data for about 30 minutes before being overwritten with new data in a circular fashion. John gets the SID and SERIAL# of Janice’s session and issues this query against the V$ACTIVE_SESSION_HISTORY view to find out the wait events for which this session waited in the past.

select sample_time, event, wait_time
from v$active_session_history
where session_id = 271
and session_serial# = 5;

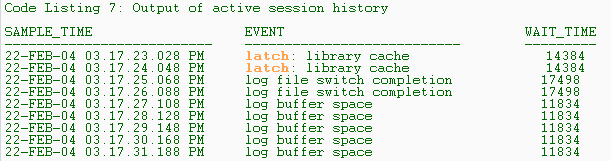
The output, excerpted in Listing 7, shows several important pieces of information. First it shows SAMPLE_TIME?the time stamp showing when the statistics were collected?which lets John tie the occurrence of the performance problems to the wait events. Using the data in the V$ACTIVE_SESSION_HISTORY view, John sees that at around 3:17 p.m., the session waited several times for the log buffer space event, indicating that there was some problem with redo log buffers. To further aid the diagnosis, John identifies the exact SQL statement executed by the session at that time, using the following query of the V$SQL view:

select sql_text, application_wait_time
from v$sql
where sql_id in (
select sql_id
from v$active_session_history
where sample_time =
’22-FEB-04 03.17.31.188 PM’
and session_id = 271
and session_serial# = 5
);

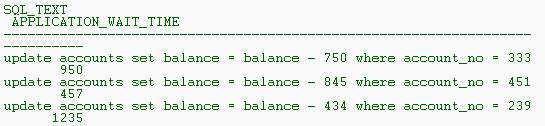
The output is shown in Listing 8.
The column APPLICATION_WAIT_TIME shows how long the sessions executing that SQL waited for the application wait class. In addition to the SQL_ID, the V$ACTIVE_SESSION_HISTORY view also lets John see specific rows being waited for (in case of lock contentions), client identifiers, and much more.

What if a user comes to John a little late, after the data is overwritten in this view? When purged from this dynamic performance view, the data is flushed to the Active Workload Repository (AWR), a disk-based repository. The purged ASH data can be seen in the DBA_HIST_ACTIVE_SESSION_HIST view, enabling John to see the wait events of a past session. The data in the AWR is purged by default after seven days.

Conclusion : Oracle Database 10g introduces a number of enhancements designed to automate and simplify the performance diagnostic process. Wait event information is more elaborate in Oracle Database 10g and provides deeper insight into the cause of problems, making the diagnosis of performance problems a breeze in most cases, especially in proactive performance tuning.

Identifying Blocking Locks/ Contention & Resolving Database Hanging Issue

Posted by Sagar Patil

One of my 10.2.0.1 database was hanging despite allocating ample opf resources. The CPU, Memory,Disk accesses were normal but under heavy load server would freeze for no valid reason. I had to raise TAR with Oracle.

My Statspack report had following details

—–Enqueue activity DB/Inst:
-> only enqueues with waits are shown
-> Enqueue stats gathered prior to 10g should not be compared with 10g data
-> ordered by Wait Time desc, Waits desc

Enqueue Type (Request Reason)
——————————————————————————
Requests Succ Gets Failed Gets Waits Wt Time (s) Av Wt Time(ms)
———— ———— ———– ———– ———— ————–
TX-Transaction (row lock contention)
6,611 6,615 0 6,615 32,521 4,916.24

Above list indicates oracle was waiting about 4 secs to get lock . Enqueue is a SGA memory structure used by Oracle.

Oracle support suggested to locate hot sql and hot block like table/index/cluster to reoslve this issue.

There are some articles on google but this PDF “Resolving_Oracle_Latch_Contention.pdf” from Guy Harrison at Quest is interesting …

Avoiding Hot Blocks
Cache buffers chains latch contention is one of the most intractable types of latch contention. There are a couple of things you can do at the application level to reduce the severity of this type of contention.
Firstly, identify the blocks that are hot.? Metalink note 163424.1, “How to Identify a Hot Block Within The Database”? describes how to do this. Having identified the identity of the hot block, you will most likely find that it is an index root or branch block.

It was suggested by Oracle support to look at Locks and provide them historical information about it. I couldn’t see any blokcing locks i TOAD/ deadlocks at alrtlog so I was surelocks are not the isse but I had to do what Oracle suypport suggested. So here is what I did.

Unix Shell script Process Stack diagnosis.
#!/usr/bin/ksh
# Create Oracle Trace
# Script 3 : Get Dump of Pmon, Smon & lgwr processes
# Pmon,Smon & Lgwr script files created in same directory
# Please use ./option3.sh <SID> for results
#################################################################################
export PID_PMON=$(ps -ef | grep ora_pmon_$1 | sed -e ‘/pts/d’ | awk ‘{print $2}’)
export PID_SMON=$(ps -ef | grep ora_smon_$1 | sed -e ‘/pts/d’ | awk ‘{print $2}’)
export PID_LGWR=$(ps -ef | grep ora_lgwr_$1 | sed -e ‘/pts/d’ | awk ‘{print $2}’)
echo $PID_PMON
echo $PID_SMON
echo $PID_LGWR
/usr/bin/pstack $PID_PMON > $1_PMON.log
/usr/bin/pstack $PID_SMON > $1_SMON.log
/usr/bin/pstack $PID_LGWR > $1_LGWR.log

# SQL script to carry system state dump
# Please execute this file by connecting to background sqlplus sessoion on live
# Once done please upload trace files created at $ORACLE_HOME/UDUMP to Oracle support
set term off;
set scan off;
set define off;
alter session set max_dump_file_size=unlimited;
alter session set events ‘immediate trace name systemstate level 266’;
exec sys.dbms_lock.sleep(60);
alter session set max_dump_file_size=unlimited;
alter session set events ‘immediate trace name systemstate level 266’;
exec sys.dbms_lock.sleep(60);
alter session set max_dump_file_size=unlimited;
alter session set events ‘immediate trace name systemstate level 266’;
exec sys.dbms_lock.sleep(60);
alter session set max_dump_file_size=unlimited;
alter session set events ‘immediate trace name systemstate level 266’;
set term on;
set scan on;
set define on;

I have also created a small pl/sql procedure to locate blocking locks on system. This procedure will create a txt spool file with relevant details. Monitor these spool files over period of time to see which is a hot object.

CREATE OR REPLACE procedure locate_blocking_sid as
t_sid number;
t_sql_text varchar2(200);
msg varchar2(2000);
maxlinesize NUMBER := 32767;
log_file_handle UTL_FILE.file_type;
cursor c1 is
select sid, blocking_session,event, seconds_in_wait,wait_time
from sys.v_$session where state in (‘WAITING’)
and wait_class != ‘Idle’;
c1_rec c1%ROWTYPE;

cursor C2 (t_sid VARCHAR2, t_blocking_session varchar2) is
select ‘ ‘|| sql_text || sid
from sys.v_$session s, v$sql q
where sid in (t_sid,t_blocking_session)
and (
q.sql_id = s.sql_id or
q.sql_id = s.prev_sql_id);

BEGIN
log_file_handle := UTL_FILE.fopen(‘/oracle/app/oracle/admin/startp/udump’,’blocking_locks ‘||to_char(sysdate,’DD-MM-YY HH24:MI’)||’.txt’,’w’,maxlinesize);
— log_file_handle := UTL_FILE.fopen(‘/oracle/app/oracle/admin/catp/udump’,’blocking_locks’,’w’);
UTL_FILE.PUT_LINE(log_file_handle, ‘ SQL Running & V$ Session ID ;’|| ‘ Event for Wait ;’||’ Seconds in Wait ;’ || ‘ Wait Time’);
open c1;
loop
FETCH c1 INTO c1_rec;
EXIT WHEN c1%NOTFOUND;

BEGIN
open c2(c1_rec.sid,c1_rec.blocking_session);
Loop
FETCH c2 into msg;
msg := msg || ‘ ; ‘|| trim(c1_rec.event)|| ‘ ;’|| c1_rec.seconds_in_wait||’ ; ‘||c1_rec.wait_time;
EXIT WHEN c2%NOTFOUND;
UTL_FILE.PUT_LINE(log_file_handle,msg );
End Loop;
close c2;
END;
end loop;
close c1;
UTL_FILE.FCLOSE(log_file_handle);
end;
/

PLSQL Help: Execute Immediate with Parameters

Posted by Sagar Patil

Example 1 : Running Execute immediate with an OUT parameter.

I wanted to output a count of tables to see if there is a data difference between Live/Test. I would have created a SQL script but it is hard to share with other developers so I found creating a procedure handy.

Create or replace procedure update_row_count as
l_count number;
l_sql_error_message varchar2(100) :=NULL;
SQL_STMT varchar2(200) :=NULL;
TYPE table_name_type IS VARRAY(7) OF VARCHAR2(30);
table_names table_name_type
:= table_name_type
(‘EMP’,
‘DEPT’,
‘SALARY’);
BEGIN
FOR i IN Table_Names.FIRST..Table_Names.LAST
LOOP
SQL_STMT := ‘SELECT COUNT(*) FROM SCOTT.’||table_names(i);
EXECUTE IMMEDIATE sql_stmt INTO l_count;
l_sql_error_message := SUBSTR(SQLERRM, 1, 100);
DBMS_OUTPUT.PUT_LINE(‘TABLE : ‘||upper(table_names(i)) || ‘ ‘|| l_count);
END LOOP;
EXCEPTION
WHEN OTHERS THEN
dbms_output.put_line(‘Others Error Message : ‘||l_sql_error_message);
END;
set serverout on size 10000;
/
exec update_row_count;

For an IN and OUT parameters you would do

EXECUTE IMMEDIATE ‘BEGIN SCOTT.’|| Table_Names(i)||'(:1,:2,:3);END;’

USING parameter1,OUT parameter2,OUT parameter3;

Example 2 : Running Execute immediate with number of IN parameters. In an example below I am sending IN parameters Emp_id , Dept_id, Dept_name,location and retrieving Salary & Emp_rec

Create or replace procedure update_row_count as
sql_stmt VARCHAR2(200);
plsql_block VARCHAR2(500);
emp_id NUMBER(4) := 7566;
salary NUMBER(7,2);
dept_id NUMBER(2) := 50;
dept_name VARCHAR2(14) := ‘PERSONNEL’;
location VARCHAR2(13) := ‘DALLAS’;
emp_rec emp%ROWTYPE;
BEGIN
EXECUTE IMMEDIATE ‘CREATE TABLE bonus (id NUMBER, amt NUMBER)’;
sql_stmt := ‘INSERT INTO dept VALUES (:1, :2, :3)’;
EXECUTE IMMEDIATE sql_stmt USING dept_id, dept_name, location;
sql_stmt := ‘SELECT * FROM emp WHERE empno = :id’;
EXECUTE IMMEDIATE sql_stmt INTO emp_rec USING emp_id;
plsql_block := ‘BEGIN emp_pkg.raise_salary(:id, :amt); END;’;
EXECUTE IMMEDIATE plsql_block USING 7788, 500;
sql_stmt := ‘UPDATE emp SET sal = 2000 WHERE empno = :1
RETURNING sal INTO :2’;
EXECUTE IMMEDIATE sql_stmt USING emp_id RETURNING INTO salary;
EXECUTE IMMEDIATE ‘DELETE FROM dept WHERE deptno = :num’
USING dept_id;
EXECUTE IMMEDIATE ‘ALTER SESSION SET SQL_TRACE TRUE’;
END;

The Oracle 10g Scheduler

Posted by Sagar Patil

Oracle 10g’s DBMS_SCHEDULER provides significant improvements over DBMS_JOB for scheduling jobs and tasks. Let’s take an overview of new functionalities that the Oracle Scheduler provides for DBAs.

There are three basic components to DBMS scheduler: Programs,Schedules & Jobs

Programs : A program defines what Scheduler will execute. A program’s attributes include its name, its type (e.g. a PL/SQL procedure or anonymous block), and the action it is expected to perform.
Schedules : A schedule defines when and at what frequency the Scheduler will execute a particular set of tasks.
Jobs : A job assigns a specific task to a specific schedule. A job therefore tells the schedule which tasks – either one-time tasks created “on the fly,” or predefined programs – are to be run.

Job Classes: The Scheduler provides the capability to group together jobs that have similar resource demands into job classes.

Windows : Most businesses have periods of peak and off-peak. The scheduler provides concept of windows to assign resources to job classes.

Window Groups : The Scheduler also allows windows with similar scheduling properties – for example, normal business weekday off-peak time, weekends and holidays – to be collected within window groups for easier management of jobs and scheduled tasks.

Window Overlaps: It is possible to have windows overlap each other, and it does provide a simple conflict-resolution method to insure that the appropriate jobs do get the appropriate resources.

DBMS_JOB DBMS_SCHEDULER

— Schedule an Analyze job at 10PM
BEGIN
DBMS_JOB.SUBMIT (
job => :jobno
,what => ‘BEGIN DBMS_STATS.GATHER_SCHEMA_STATS(”ORACLEDBA”);END;’
,next_date => ’29/01/2009 22:00:00′
,interval => ‘TRUNC(SYSDATE) + 1 + 22/24’);
END;

BEGIN
DBMS_SCHEDULER.CREATE_JOB (
job_name => ‘REFRESH_STATS_ORACLEDBA_SCHEMA’
,job_type => ‘PLSQL_BLOCK’
,job_action => ‘BEGIN DBMS_STATS.GATHER_SCHEMA_STATS(”ORACLEDBA”);END;’
,start_date => ”29/01/2009 10:00 PM’
,repeat_interval => ‘FREQ=DAILY’
,enabled => TRUE
,comments => ‘Refreshes the ORACLEDBA Schema every night at 10 PM’);
END;

Let’s put the theory into practise. One of the common task as a DBA is setting up ANALYZE job for number of Oracle Database users.Let’s try and achieve it using the new DBMS_SCHEDULER API

————– Above task could be scheuled in a single API as below
BEGIN
DBMS_SCHEDULER.DROP_JOB ( job_name => ‘ANALYZE_USERS’ ,force => TRUE);
DBMS_SCHEDULER.CREATE_JOB (
job_name => ‘ANALYZE_USERS’
,job_type => ‘PLSQL_BLOCK’
,job_action => ‘BEGIN DBMS_STATS.GATHER_SCHEMA_STATS(”SALES”);DBMS_STATS.GATHER_SCHEMA_STATS(”Marketing”);DBMS_STATS.GATHER_SCHEMA_STATS(”HR”);END;’
,start_date => ’09/10/2009 22:00:00.000000′
,repeat_interval => ‘FREQ=DAILY’
,enabled => FALSE
,comments => ‘Refreshes the Schemas every night at 10 PM’
);
END;

Let’s try and use new feaures and strengths of 10g Scheduler

We need to create
1. A schedule object that controls when the various schema refreshes should run
2. A program object that handles calling appropriate procedure for Analyze refresh
3..A job object that invoke the program at the scheduled time

1. Creating Schedule Object: I want to schdule schema refresh on Sundays after 22:00 hours (off-peak time).

————– SQL for Creating a Schedule Object
BEGIN
DBMS_SCHEDULER.DROP_SCHEDULE( schedule_name => ‘RefreshSchemas’ ,force => TRUE );
DBMS_SCHEDULER.CREATE_SCHEDULE (
schedule_name => ‘RefreshSchemas’
,start_date => ’25/10/2009 22:00:00′
,repeat_interval => ‘FREQ=WEEKLY’
,comments => ‘Weekly schema statistics refresh’ );
END;

2. Creating Program Objects : I will create a program object named REFRESHHRSCHEMA without any arguments that will handle refreshes of just the one HR schema. I have multiple schmas so I could use following SQL for each one of them.

————– SQL for Creating a Simple Program Object
BEGIN
DBMS_SCHEDULER.CREATE_PROGRAM (program_name => ‘ReFreshSchema’
,program_type => ‘PLSQL_BLOCK’
,program_action => ‘BEGIN DBMS_STATS.GATHER_SCHEMA_STATS(”HR”);END;’
,number_of_arguments => 0
,enabled => TRUE
,comments => ‘Freshens statistics for all objects in HR schema only’
);
END;

3. Creating Job Objects: Finally, I will add a job object that assigns specific task within a specific schedule. I will need to create one job object for each schema for which statistics need to be refreshed.

————– SQL for Creating Job Using Existing Schedule and Program Objects
BEGIN
DBMS_SCHEDULER.DROP_JOB (
job_name => ‘HR_REFRESHSCHEMA’
,force => TRUE);

DBMS_SCHEDULER.CREATE_JOB (
job_name => ‘HR_REFRESHSCHEMA’
,program_name => ‘REFRESHSCHEMA’
,schedule_name => ‘REFRESHSCHEMAS’
,enabled => FALSE
,comments => ‘Refreshes the HR Schema every week’
);
END;

Now we have new scheduler and added a Analyze job but how would we locate Success /Failure of Scheduler jobs?

————– Show Scheduler database objects
TTITLE ‘Scheduler Objects:’
COL owner FORMAT A08 HEADING ‘Owner’
COL object_type FORMAT A12 HEADING ‘Object|Type’
COL object_name FORMAT A20 HEADING ‘Name’
COL created FORMAT A20 HEADING ‘Created On’
COL status FORMAT A12 HEADING ‘Status’

SELECT
owner ,object_type ,object_name ,created ,status
FROM dba_objects
WHERE object_type IN (‘PROGRAM’, ‘JOB’, ‘JOB CLASS’, ‘SCHEDULE’, ‘WINDOW’)
ORDER BY object_type, OBJECT_name;

————– Show Schedule objects
TTITLE ‘Schedules:’
COL owner FORMAT A08 HEADING ‘Owner’
COL schedule_name FORMAT A20 HEADING ‘Schedule’
COL start_date FORMAT A20 HEADING ‘Starts|On’
COL end_date FORMAT A20 HEADING ‘Ends|On’
COL repeat_interval FORMAT A45 HEADING ‘Interval’

SELECT
owner ,schedule_name ,to_char(start_date, ‘mm/dd/yyyy hh24:mi:ss’) start_date ,to_char(end_date, ‘mm/dd/yyyy hh24:mi:ss’) end_date ,repeat_interval
FROM dba_scheduler_schedules;

————– Show Program objects : What program objects are available?
TTITLE ‘Programs:’
COL owner FORMAT A08 HEADING ‘Owner’
COL program_name FORMAT A20 HEADING ‘Program’
COL program_type FORMAT A16 HEADING ‘Type’
COL program_action FORMAT A32 HEADING ‘Action’

SELECT
owner
,program_name
,program_type
,program_action
FROM dba_scheduler_programs;

— What program’s arguments are attached?
TTITLE ‘Program Arguments:’
COL owner FORMAT A08 HEADING ‘Owner’
COL program_name FORMAT A20 HEADING ‘Program’
C
OL argument_name FORMAT A12 HEADING ‘Arg Name’
COL argument_position FORMAT 999 HEADING ‘Arg|Pos’
COL argument_type FORMAT A12 HEADING ‘Arg Type’
COL default_value FORMAT A12 HEADING ‘Default|Value’
COL out_argument FORMAT A06 HEADING ‘Out|Arg?’

SELECT owner ,program_name ,argument_name ,argument_position ,argument_type ,default_value ,out_argument
FROM dba_scheduler_program_args;

————– Show Job objects
COL owner FORMAT A08 HEADING ‘Owner’
COL job_name FORMAT A20 HEADING ‘Job’
COL program_name FORMAT A20 HEADING ‘Program|Name’
COL job_class FORMAT A24 HEADING ‘Job Class’
COL job_type FORMAT A12 HEADING ‘Job|Type’
COL job_action FORMAT A12 HEADING ‘Job|Action’

TTITLE ‘Jobs:’
SELECT
owner ,job_name ,state ,job_class ,job_type ,job_action
FROM dba_scheduler_jobs;

COL owner FORMAT A08 HEADING ‘Owner’
COL job_name FORMAT A20 HEADING ‘Job’
COL program_name FORMAT A20 HEADING ‘Program|Name’
COL schedule_name FORMAT A20 HEADING ‘Schedule|Name’
COL enabled FORMAT A08 HEADING ‘Enabled?’
COL state FORMAT A08 HEADING ‘State’
COL restartable FORMAT A08 HEADING ‘Restart|-able?’
COL start_date FORMAT A32 HEADING ‘Start|Date’

TTITLE ‘Job Components:’
SELECT
owner ,job_name ,program_name ,schedule_name ,enabled ,state ,restartable ,start_date
FROM dba_scheduler_jobs;

————– What are a Job’s arguments?
COL job_name FORMAT A20 HEADING ‘Job’
COL argument_name FORMAT A12 HEADING ‘Arg Name’
COL argument_position FORMAT 999 HEADING ‘Arg|Pos’
COL value FORMAT A32 HEADING ‘Argument Value’

TTITLE ‘Job Arguments:’
SELECT job_name ,argument_name ,argument_position ,value
FROM dba_scheduler_job_args;

————– Show Scheduled Tasks History: Show a high-level view of scheduled task execution history
COL log_id FORMAT 9999 HEADING ‘Log#’
COL log_date FORMAT A32 HEADING ‘Log Date’
COL owner FORMAT A06 HEADING ‘Owner’
COL job_name FORMAT A20 HEADING ‘Job’
COL status FORMAT A10 HEADING ‘Status’

TTITLE ‘Scheduled Tasks History:’
SELECT
log_id ,log_date ,owner ,job_name ,status
FROM dba_scheduler_job_log;

————– What scheduled tasks failed during execution, and Error details
COL log_id FORMAT 9999 HEADING ‘Log#’
COL log_date FORMAT A32 HEADING ‘Log Date’
COL owner FORMAT A06 HEADING ‘Owner’
COL job_name FORMAT A20 HEADING ‘Job’
COL status FORMAT A10 HEADING ‘Status’
COL actual_start_date FORMAT A32 HEADING ‘Actual|Start|Date’
COL error# FORMAT 999999 HEADING ‘Error|Nbr’

TTITLE ‘Scheduled Tasks That Failed:’
SELECT
log_id ,log_date ,owner ,job_name ,status ,actual_start_date ,error#
FROM dba_scheduler_job_run_details
WHERE status <> ‘SUCCEEDED’
ORDER BY actual_start_date;

————– Which jobs are running right now ?
COL owner FORMAT A06 HEADING ‘Owner’
COL job_name FORMAT A20 HEADING ‘Job’
COL session_id FORMAT 999999 HEADING ‘Session’
COL running_instance FORMAT A10 HEADING ‘Running|Instance’
COL elapsed_time FORMAT A12 HEADING ‘Elapsed|Time’

TTITLE ‘Scheduled Tasks Running Right Now:’
SELECT
owner ,job_name ,session_id ,running_instance ,elapsed_time
FROM dba_scheduler_running_jobs;

How to Convert Physical Machines to Virtual Machines with VMware Converter

Posted by Sagar Patil

The VMware Converter is amazing piece of software which will:
1) Import a Virtual Machine from a physical machine
2) Configure newly created Virtual Machine to make an existing image bootable

In this case, I am going to demonstrate how you can import a physical running machine (while that machine is running).

Server /IP EBS /192.168.2.114 (PhySical) ESXi/ 192.168.2.110 (Virtual)
Hard Disk Space 274 GB of Local SCSI space 274 GB on Openfiler Storage
Applications Running Oracle EBS Suite Release 12
Make/Model Dell PowerEdge 2650 Dell PowerEdge 2650
Memory 6 GB 8 GB allocated 3.4 GB

First download a VMware converter, here standalone in my case. Install it and click on a “Convert Machine” icon.

Enter the machine IP address/ Root username and password to be virtualized

Now enter ESXi host details. I have mounted a terabyte HDD space on my ESXi using openfiler and I wish to push this machine to my SAN storage.

Adjust settings you want altered at destination for example Memory size, CPU numbers, HDD volumes

Click on finish and you will be presented a monitoring console as below. Now wait until it’s all done. For me it’s about 7 hours. The speed of copying is fairly slow despite having a network bandwidth of 1GBPS between all nodes.

If you look at vmware console , you will see progress details as below

One can also monior the progress by looking at File -> Export Logs -> vmware-converter-agent-XXX.log file

Maintain RMAN Catalog

Posted by Sagar Patil

Below is a windows BATCH script used to Maintain RMAN catalogue. The script accepts 3 parameters Target SID, Target password and catalogue password.

@echo off
REM
REM NT RMAN catalogue maintenance
REM
REM 3 parameters SID, target password and catalogue password
REM

set ORACLE_SID=%1
set LOG=C:\rmanscripts\maintain_%1.log

REM
REM First generate the rman script using the two supplied parameters
REM

echo connect target rmantarget/%2@%1 >C:\rmanscripts\maintain_catalog.rman
echo connect catalog rman/%3@recovery_catalog >>C:\rmanscripts\maintain_catalog.rman
echo allocate channel for maintenance type “sbt_tape” >>C:\rmanscripts\maintain_catalog.rman
echo crosscheck backup of database; >>C:\rmanscripts\maintain_catalog.rman
echo release channel; >>C:\rmanscripts\maintain_catalog.rman
echo allocate channel for maintenance type “sbt_tape” >>C:\rmanscripts\maintain_catalog.rman
echo crosscheck backup of archivelog all; >>C:\rmanscripts\maintain_catalog.rman
echo release channel; >>C:\rmanscripts\maintain_catalog.rman
echo allocate channel for delete type “sbt_tape”; >>C:\rmanscripts\maintain_catalog.rman
echo delete noprompt expired backup; >>C:\rmanscripts\maintain_catalog.rman
echo release channel; >>C:\rmanscripts\maintain_catalog.rman
echo exit >>C:\rmanscripts\maintain_catalog.rman

REM
REM Second generate the email call script
REM

echo connect rman/%3@recovery_catalog >C:\rmanscripts\send_email.sql
echo define subject=^&1 >>C:\rmanscripts\send_email.sql
echo define sender=^&2 >>C:\rmanscripts\send_email.sql
echo execute send_email_header(‘^&subject’,’^&sender’); >>C:\rmanscripts\send_email.sql
echo exit >>C:\rmanscripts\send_email.sql

date /t> %LOG%
time /t >> %LOG%
For /F “tokens=1,2,3,4* delims=/, ” %%i in (‘date/T’) Do SET DDMMYYYY=%%i-%%j-%%k

rman msglog=%LOG% cmdfile=C:\rmanscripts\maintain_catalog.rman

if not errorlevel 1 (
sqlplus -s /nolog @C:\rmanscripts\send_email.sql \”‘RMAN catalog maintenance complete on %DDMMYYYY%’\” %COMPUTERNAME%
) else (
sqlplus -s /nolog @C:\rmanscripts\send_email.sql \”‘RMAN catalog maintenance failure on %DDMMYYYY%’\” %COMPUTERNAME%
)
exit

Please compile send_email_header pl/sql procedure as rman user.

CREATE OR REPLACE PROCEDURE send_email_header(
msg_subject varchar2 ,
msg_sendner varchar2 )
IS
c utl_tcp.connection;
rc integer;
BEGIN
c := utl_tcp.open_connection(‘127.0.0.1’, 25); — open the SMTP port 25 on local machine
dbms_output.put_line(utl_tcp.get_line(c, TRUE));
rc := utl_tcp.write_line(c, ‘HELO localhost’);
dbms_output.put_line(utl_tcp.get_line(c, TRUE));
rc := utl_tcp.write_line(c, ‘MAIL FROM: ‘||msg_sender);
dbms_output.put_line(utl_tcp.get_line(c, TRUE));
rc := utl_tcp.write_line(c, ‘RCPT TO: ‘||’dba@oracledbasupport.co.uk’);
dbms_output.put_line(utl_tcp.get_line(c, TRUE));
rc := utl_tcp.write_line(c, ‘QUIT’);
dbms_output.put_line(utl_tcp.get_line(c, TRUE));
utl_tcp.close_connection(c); — Close the connection
EXCEPTION
when others then
raise_application_error(
-20000, ‘Unable to send e-mail message from pl/sql because of: ‘||
sqlerrm);
END;
/
show errors

Rman Script to Create Standby/Duplicate database using RMAN

Posted by Sagar Patil

Duplicate Database using rman

connect target rman/%password%@primary_server
connect auxiliary sys/%password%@standby_server
connect rcvcat rman/%password%@recovery_catalog
run {
set until time ’27-JUL-2009 10:59:00′;
allocate auxiliary channel tp1 type “sbt_tape”;
allocate auxiliary channel tp2 type “sbt_tape”;

duplicate target database to %target_instance_name%;
release channel tp1;
release channel tp2;
}

Restore rman database for Standby

connect target rman/%password%@primary_server
connect auxiliary sys/%password%@standby_server
connect rcvcat rman/%password%@recovery_catalog
Run {
set until time ’20-SEP-2009 06:03:00′;
allocate auxiliary channel tp1 type “sbt_tape”;
allocate auxiliary channel tp2 type “sbt_tape”;

duplicate target database for standby dorecover nofilenamecheck;
release channel tp1;
release channel tp2;
}

Remove Failed Clusterware

Posted by Sagar Patil

If you have already uninstalled Oracle Clusterware using the Oracle Universal Installer – Please download attached file cleanup.zip that contains a copy of the logpartformat.exe and the guioracleobjmanage.exe (plus necessary dll).

In case you have Clusterware installed – (You need to carry these steps only from one node)

Remove the partitions that have been initialized for ocrcfg and votedsk

1. You can view these using the Oracle provided tool: guioracleobjmanager.exe
Invoke the Oracle tool GuiOracleObjManager.exe to see the link names that have been assigned to your partitions:

clip_image002

2. Use Services on Windows to stop the following services on each cluster node and set them to Manual. Please stop all oracle services.

clip_image004

clip_image006

3. Remove the formatting on these partitions using the Oracle provided tool: logpartformat.exe. Invoke the Oracle tool logpatformat to reinitialize the headers of the disks you have specified for use as votedsk1 and ocrcfg

For RAW partitions:

run logpartformat /q <link name as shown to you in guioracleobjmanager tool
For example “logpartformat /q ocrcfg” repeat this step for all link names listed in guioracleobjmanager

clip_image008

For OCFS:

run logpartformat /q <DRIVELETTER>
For example, if the drive letter for your OCFS partition is ‘ P ‘

logpartformat /q P:

Certain times Logpartformat can fail. For example:

$CRS_HOME/BIN>logpartformat /q \\.\votedsk1
Logical Partition Formatter
Version 2.0
Copyright 1989-2001 Oracle Corporation. All rights reserved.
Unable to validate logical partition for symbolic link votedsk1

This is typically an access problem but cleaning up the disks can be problematic in such a case. Physically removing the disks and creating new ones with different sizes has been known to help in some cases.

4. Remove the assigned link names using the GUIOracleobjmanager.exe
– Go back to the guioracleobjmanager tool and remove all link names:
– place a check mark in the box preceding each link name / physical partition listed
– then go to the Options menu and click ‘commit
– the link names should now be removed

clip_image010 clip_image012

5. If possible remove and recreate your logical drives on top of extended partitions at this time from Windows Disk Management.

6. Use the Oracle Universal Installer to remove the empty CRS home (cleans up the inventory file)

7. Remove Oracle binaries using Windows explorer, both the CRS home and the files located in:

8. Using Windows explorer, remove the following driver files from: %systemroot%\windows\system32\drivers:
* ocfs.sys
* orafencedrv.sys
* orafenceservice.sys

9. Reboot all servers in your RAC configuration

You can also look at metalink note 341214.1

11g RAC : Download & Install cluvfy(Cluster verify) Utility

Posted by Sagar Patil

How do I install CVU from OTN? Download From Here

1. Create a CV home( say /home/username/mycvhome ) directory. It should have at least 35M of free disk space.
2. cd /home/username/mycvhome
3. copy the cvupack_<platform>.zip file to /home/username/mycvhome
4. unzip the file: unzip cvupack<platform>.zip
5. (Optional) Set the environmental variable CV_DESTLOC. This should point to a writable area on *all* nodes. When invoked, the tool will attempt to copy the necessary bits as required to this location. Make sure the location exists on all nodes and it has write permission for CVU user. It is strongly recommended that you should set this variable. If this variable has not been set, CVU will use “/tmp” as the default. “setenv CV_DESTLOC /tmp/cvu_temp”

How do I know about cluvfy commands?
-type ‘cluvfy comp -list’

how to check the entire Oracle Clusterware stack
– cluvfy stage -post crsinst

How do I check the Oracle Clusterware stack and other sub-components of it?
– Use the ‘comp ocr’ command to check the integrity of OCR. Similarly, you can use ‘comp crs’ and ‘comp clumgr’ commands to check integrity of Oracle Clustereare and clustermanager sub-components.

How do I get detail output of a check?
– Cluvfy supports a verbose mode. By default, cluvfy reports in non-verbose mode. To get detailed output of a check, use the flag ‘-verbose’ in the command line.

How do I check network or node connectivity related issues?
-Use commands like ‘nodereach’ or ‘nodecon’ for this purpose.For syntax, type comp -help command on the command prompt.
If the ‘comp nodecon’ command is invoked without -i, cluvfy will attempt to discover all the available interfaces and the corresponding IP address & subnet. Then cluvfy will try to verify the node connectivity per subnet. You can run this command in verbose mode

SQLIO SAN/Local Disk Subsystem Benchmark Tool

Posted by Sagar Patil
  1. Download http://www.microsoft.com/downloads/details.aspx?familyid=9a8b005b-84e4-4f24-8d65-cb53442d9e19&displaylang=en and install SQLIO
  2. It will be installed under C:\Program Files\SQLIO. Please add this directory in your FIle Path
  3. SQLIO will need a test file to run against your drives for performance.

First look at C:\SQLIO\param.txt which would look like something below.

  • First parameter (D:\testfile.dat)- the physical location of the testing file. Change the drive letter to point to the SAN drive you want to test, like D:\testfile.dat here.
  • Last parameter (10)- the size of the testing file in megabytes. Increase this to 20480 or larger.

Now run following command to create D:\testfile.dat. test file. “sqlio -kW -s10 -fsequential -o8 -b8 -LS -Fparam.txt timeout /T 10”

Please see there is a file created at “D:\testfile.dat”, here 100MB as I defined it in the param.txt

Testing Your SAN Performance:

Let’s create a batch file SAN_RESULTS.TXT to take all of the possibilities and run them all.

— Random Reads
sqlio -kW -t3 -s90 -dD -o1 -frandoD -b64 -BH -LS Testfile.dat
sqlio -kW -t3 -s90 -dD -o2 -frandoD -b64 -BH -LS Testfile.dat
sqlio -kW -t3 -s90 -dD -o4 -frandoD -b64 -BH -LS Testfile.dat
sqlio -kW -t3 -s90 -dD -o8 -frandoD -b64 -BH -LS Testfile.dat
sqlio -kW -t3 -s90 -dD -o16 -frandoD -b64 -BH -LS Testfile.dat
sqlio -kW -t3 -s90 -dD -o32 -frandoD -b64 -BH -LS Testfile.dat
sqlio -kW -t3 -s90 -dD -o64 -frandoD -b64 -BH -LS Testfile.dat
sqlio -kW -t3 -s90 -dD -o128 -frandoD -b64 -BH -LS Testfile.dat

— Sequential Reads
sqlio -kW -t3 -s90 -dD -o1 -fsequential -b64 -BH -LS Testfile.dat
sqlio -kW -t3 -s90 -dD -o2 -fsequential -b64 -BH -LS Testfile.dat
sqlio -kW -t3 -s90 -dD -o4 -fsequential -b64 -BH -LS Testfile.dat
sqlio -kW -t3 -s90 -dD -o8 -fsequential -b64 -BH -LS Testfile.dat
sqlio -kW -t3 -s90 -dD -o16 -fsequential -b64 -BH -LS Testfile.dat
sqlio -kW -t3 -s90 -dD -o32 -fsequential -b64 -BH -LS Testfile.dat
sqlio -kW -t3 -s90 -dD -o64 -fsequential -b64 -BH -LS Testfile.dat
sqlio -kW -t3 -s90 -dD -o128 -fsequential -b64 -BH -LS Testfile.dat

  • -kW means writes (as opposed to reads)
  • -t23means two threads
  • -s120 means test for 120 seconds
  • -dD means drive letter D (Please edit and add your SAN drive there)
  • -o1 means one outstanding request (not piling up requests)
  • -frandom means random access (as opposed to sequential)
  • -b64 means 64kb IOs

Commonly used SQLIO.exe options

Option

Description

-o

Specify the number of outstanding I/O requests. Increasing the queue depth may result in a higher total throughput. However, increasing this number too high may result in problems (described in more detail below). Common values for this are 8, 32, and 64.

-LS

Capture disk latency information. Capturing latency data is recommended when testing a system.

-k

Specify either R or W (read or write).

-s

Duration of test (seconds). For initial tests, running for 5-10 minutes per I/O size is recommended to get a good idea of I/O performance.

-b

Size of the IO request in bytes.

-f

Type of IO to issue. Either ‘random’ or ‘sequential’.

-F

Name of the file which will contain the test files to run SQLIO against.

Then go to the command prompt in the same directory as SQLIO is installed and type: “SANTESTER.BAT > SAN_RESULTS.TXT ” , You will see a output like below.


For in depth details see Using SQLIO.rtf


C:\Program Files\SQLIO>REM — Sequential Reads

C:\Program Files\SQLIO>sqlio -kW -t1 -s90 -dD -o1 -fsequential -b64 -BH -LS Testfile.dat
sqlio v1.5.SG
using system counter for latency timings, 3579545 counts per second
1 thread writing for 90 secs to file D:Testfile.dat
using 64KB sequential IOs
enabling multiple I/Os per thread with 1 outstanding
buffering set to use hardware disk cache (but not file cache)
using current size: 100 MB for file: D:Testfile.dat
initialization done
CUMULATIVE DATA:
throughput metrics:
IOs/sec: 353.01
MBs/sec: 22.06
latency metrics:
Min_Latency(ms): 0
Avg_Latency(ms): 2
Max_Latency(ms): 748
histogram:
ms: 0 1 2 3 4 5 6 7 8 9 10 11 12 13 14 15 16 17 18 19 20 21 22 23 24+
%: 52 36 8 0 0 0 0 0 0 0 0 0 0 0 0 0 0 0 0 0 0 0 0 0 2

C:\Program Files\SQLIO>sqlio -kW -t1 -s90 -dD -o2 -fsequential -b64 -BH -LS Testfile.dat
sqlio v1.5.SG
using system counter for latency timings, 3579545 counts per second
1 thread writing for 90 secs to file D:Testfile.dat
using 64KB sequential IOs
enabling multiple I/Os per thread with 2 outstanding
buffering set to use hardware disk cache (but not file cache)
using current size: 100 MB for file: D:Testfile.dat
initialization done
CUMULATIVE DATA:
throughput metrics:
IOs/sec: 473.17
MBs/sec: 29.57
latency metrics:
Min_Latency(ms): 0
Avg_Latency(ms): 3
Max_Latency(ms): 331
histogram:
ms: 0 1 2 3 4 5 6 7 8 9 10 11 12 13 14 15 16 17 18 19 20 21 22 23 24+
%: 8 18 4 42 26 0 0 0 0 0 0 0 0 0 0 0 0 0 0 0 0 0 0 0 1

C:\Program Files\SQLIO>sqlio -kW -t1 -s90 -dD -o4 -fsequential -b64 -BH -LS Testfile.dat
sqlio v1.5.SG
using system counter for latency timings, 3579545 counts per second
1 thread writing for 90 secs to file D:Testfile.dat
using 64KB sequential IOs
enabling multiple I/Os per thread with 4 outstanding
buffering set to use hardware disk cache (but not file cache)
using current size: 100 MB for file: D:Testfile.dat
initialization done
CUMULATIVE DATA:
throughput metrics:
IOs/sec: 515.11
MBs/sec: 32.19
latency metrics:
Min_Latency(ms): 0
Avg_Latency(ms): 7
Max_Latency(ms): 350
histogram:
ms: 0 1 2 3 4 5 6 7 8 9 10 11 12 13 14 15 16 17 18 19 20 21 22 23 24+
%: 0 2 6 0 0 0 21 68 1 0 0 0 0 0 0 0 0 0 0 0 0 0 0 0 1

C:\Program Files\SQLIO>sqlio -kW -t1 -s90 -dD -o8 -fsequential -b64 -BH -LS Testfile.dat
sqlio v1.5.SG
using system counter for latency timings, 3579545 counts per second
1 thread writing for 90 secs to file D:Testfile.dat
using 64KB sequential IOs
enabling multiple I/Os per thread with 8 outstanding
buffering set to use hardware disk cache (but not file cache)
using current size: 100 MB for file: D:Testfile.dat
initialization done
CUMULATIVE DATA:
throughput metrics:
IOs/sec: 516.03
MBs/sec: 32.25
latency metrics:
Min_Latency(ms): 0
Avg_Latency(ms): 14
Max_Latency(ms): 360
histogram:
ms: 0 1 2 3 4 5 6 7 8 9 10 11 12 13 14 15 16 17 18 19 20 21 22 23 24+
%: 0 0 0 2 3 3 0 0 0 0 0 0 0 32 44 14 0 0 0 0 0 0 0 0 1

C:\Program Files\SQLIO>sqlio -kW -t1 -s90 -dD -o16 -fsequential -b64 -BH -LS Testfile.dat
sqlio v1.5.SG
using system counter for latency timings, 3579545 counts per second
1 thread writing for 90 secs to file D:Testfile.dat
using 64KB sequential IOs
enabling multiple I/Os per thread with 16 outstanding
buffering set to use hardware disk cache (but not file cache)
using current size: 100 MB for file: D:Testfile.dat
initialization done
CUMULATIVE DATA:
throughput metrics:
IOs/sec: 519.12
MBs/sec: 32.44
latency metrics:
Min_Latency(ms): 1
Avg_Latency(ms): 30
Max_Latency(ms): 364
histogram:
ms: 0 1 2 3 4 5 6 7 8 9 10 11 12 13 14 15 16 17 18 19 20 21 22 23 24+
%: 0 0 0 0 0 0 0 0 1 1 3 1 0 0 0 0 0 0 0 0 0 0 0 0 92

C:\Program Files\SQLIO>sqlio -kW -t1 -s90 -dD -o32 -fsequential -b64 -BH -LS Testfile.dat
sqlio v1.5.SG
using system counter for latency timings, 3579545 counts per second
1 thread writing for 90 secs to file D:Testfile.dat
using 64KB sequential IOs
enabling multiple I/Os per thread with 32 outstanding
buffering set to use hardware disk cache (but not file cache)
using current size: 100 MB for file: D:Testfile.dat
initialization done
CUMULATIVE DATA:
throughput metrics:
IOs/sec: 524.43
MBs/sec: 32.77
latency metrics:
Min_Latency(ms): 13
Avg_Latency(ms): 60
Max_Latency(ms): 414
histogram:
ms: 0 1 2 3 4 5 6 7 8 9 10 11 12 13 14 15 16 17 18 19 20 21 22 23 24+
%: 0 0 0 0 0 0 0 0 0 0 0 0 0 0 0 0 1 0 0 1 1 1 0 0 94

C:\Program Files\SQLIO>sqlio -kW -t1 -s90 -dD -o64 -fsequential -b64 -BH -LS Testfile.dat
sqlio v1.5.SG
using system counter for latency timings, 3579545 counts per second
1 thread writing for 90 secs to file D:Testfile.dat
using 64KB sequential IOs
enabling multiple I/Os per thread with 64 outstanding
buffering set to use hardware disk cache (but not file cache)
using current size: 100 MB for file: D:Testfile.dat
initialization done
CUMULATIVE DATA:
throughput metrics:
IOs/sec: 522.62
MBs/sec: 32.66
latency metrics:
Min_Latency(ms): 28
Avg_Latency(ms): 121
Max_Latency(ms): 507
histogram:
ms: 0 1 2 3 4 5 6 7 8 9 10 11 12 13 14 15 16 17 18 19 20 21 22 23 24+
%: 0 0 0 0 0 0 0 0 0 0 0 0 0 0 0 0 0 0 0 0 0 0 0 0 100

C:\Program Files\SQLIO>sqlio -kW -t1 -s90 -dD -o128 -fsequential -b64 -BH -LS Testfile.dat
sqlio v1.5.SG
using system counter for latency timings, 3579545 counts per second
1 thread writing for 90 secs to file D:Testfile.dat
using 64KB sequential IOs
enabling multiple I/Os per thread with 128 outstanding
buffering set to use hardware disk cache (but not file cache)
using current size: 100 MB for file: D:Testfile.dat
initialization done
CUMULATIVE DATA:
throughput metrics:
IOs/sec: 527.72
MBs/sec: 32.98
latency metrics:
Min_Latency(ms): 11
Avg_Latency(ms): 241
Max_Latency(ms): 597
histogram:
ms: 0 1 2 3 4 5 6 7 8 9 10 11 12 13 14 15 16 17 18 19 20 21 22 23 24+
%: 0 0 0 0 0 0 0 0 0 0 0 0 0 0 0 0 0 0 0 0 0 0 0 0 100


Database Engine Tuning Advisor : how to Import SQL profiler traces at DTA

Posted by Sagar Patil

Let’s create a TRACE for Performance Analysis

USE [Test]
GO
/****** Object: Table [dbo].[Person] Script Date: 07/30/2009 15:33:32 ******/
SET ANSI_NULLS ON
GO
SET QUOTED_IDENTIFIER ON
GO
SET ANSI_PADDING ON
GO
CREATE TABLE [dbo].[Person](
[ID] [int] NOT NULL,
[First] [varchar](50) COLLATE Latin1_General_CI_AS NULL,
[last] [varchar](50) COLLATE Latin1_General_CI_AS NULL,
[County] [varchar](50) COLLATE Latin1_General_CI_AS NULL,
CONSTRAINT [PK_Person] PRIMARY KEY CLUSTERED
(
[ID] ASC
)WITH (IGNORE_DUP_KEY = OFF) ON [PRIMARY]
) ON [PRIMARY]

GO
SET ANSI_PADDING OFF

Let’s enable TRACE using SQL Profiler

Click on “Events Selection” and then choose “Show All Events”. I picked up “ShowPlan All” & “Performance Statistics” & then hit RUN

One defined click on

Query Performance : Enable execution plan /IO stastics under SQL server

Posted by Sagar Patil

Enable IO and Explain Plan settings using “set options”

Run the SQL and look at “Messages” & “Execution plan” tab to see the relevant output.

SQL Server : How to Enable Intra Query Parallelism

Posted by Sagar Patil

Right click on “server name” and select “properties”

If you have BATCH processing environment , try increasing MAX degree of Parallism to enhance query performance.

SQL server will use Parallism for any SQL whose cost is more than 5

Troubleshooting Bottlenecks Using Dynamic Memory Views : Part III

Posted by Sagar Patil
  1. Windows System Monitor – PART I
  2. DBCC commands – PART II
  3. Dynamic Memory Views – PART III
  4. SQL Server Profiler – – PART IV

There are 2 types of dynamic views, System and Database views.

System views are located at System Databases -> Master -> Views -> DM_OS_XXXX

sys.dm_os_buffer_descriptors
sys.dm_os_memory_pools
sys.dm_os_child_instances
sys.dm_os_nodes
sys.dm_os_cluster_nodes
sys.dm_os_performance_counters
sys.dm_os_dispatcher_pools
sys.dm_os_process_memory
sys.dm_os_hosts
sys.dm_os_schedulers
sys.dm_os_latch_stats
sys.dm_os_stacks
sys.dm_os_loaded_modules
sys.dm_os_sys_info
sys.dm_os_memory_brokers
sys.dm_os_sys_memory
sys.dm_os_memory_cache_clock_hands
sys.dm_os_tasks
sys.dm_os_memory_cache_counters
sys.dm_os_threads
sys.dm_os_memory_cache_entries
sys.dm_os_virtual_address_dump
sys.dm_os_memory_cache_hash_tables
sys.dm_os_wait_stats
sys.dm_os_memory_clerks
sys.dm_os_waiting_tasks
sys.dm_os_memory_nodes
sys.dm_os_workers
sys.dm_os_memory_objects

Database views are located at User Database ->views -> DM_DB_XXX , DM_Exec_XXX etc

sys.dm_exec_background_job_queue
sys.dm_exec_query_optimizer_info
sys.dm_exec_background_job_queue
sys.dm_exec_query_plan
sys.dm_exec_background_job_queue_stats
sys.dm_exec_query_resource_semaphores
sys.dm_exec_cached_plans
sys.dm_exec_query_stats
sys.dm_exec_cached_plan_dependent_objects
sys.dm_exec_requests
sys.dm_exec_connections
sys.dm_exec_sessions
sys.dm_exec_cursors
sys.dm_exec_sql_text
sys.dm_exec_plan_attributes
sys.dm_exec_text_query_plan
sys.dm_exec_procedure_stats
sys.dm_exec_trigger_stats
sys.dm_exec_query_memory_grants
sys.dm_exec_xml_handles

sys.dm_db_file_space_usage
sys.dm_db_session_space_usage
sys.dm_db_partition_stats
sys.dm_db_task_space_usage
sys.dm_db_persisted_sku_features

Troubleshooting Bottlenecks : Using SQL Server Profiler & Windows System Monitor Together

Posted by Sagar Patil

Here is a situation – users are complaining about a slow SQL server response.

We want to quantify if that is result of a hard hitting SQL query or this is to do with some application/background jobs running on the server.

Let’s put to practise our skills from http://www.oracledbasupport.co.uk/troubleshooting-bottlenecks-using-sql-server-profiler-part-iv/ & http://www.oracledbasupport.co.uk/troubleshooting-bottlenecks-using-windows-system-monitor-part-i/

Please initiate a Trace on SQL server before going ahead. Within a SQL server Profiler window click on the top button for “Performancve Monitor” to enable logging.

Read more…

Troubleshooting Bottlenecks Using SQL Server Profiler : PART IV

Posted by Sagar Patil
  1. Windows System Monitor – PART I
  2. DBCC commands – PART II
  3. Dynamic Memory Views – PART III
  4. SQL Server Profiler – – PART IV

SQL Server Profiler – – PART IV


Read more…

Troubleshooting Bottlenecks Using Windows System Monitor : Part I

Posted by Sagar Patil
  1. Windows System Monitor – PART I
  2. DBCC commands – PART II
  3. Dynamic Memory Views – PART III
  4. SQL Server Profiler – – PART IV

Windows System Monitor

Read more…

Shell Script to Delete / Copy/ Zip files older than X hours

Posted by Sagar Patil

#!/bin/bash
# Delete files older than X hours.
# This script will delete files older than 3 days from $GLOBALSHARE/current/Server01
# 14 days from $GLOBALSHARE/archive/Server01 & 14 days from /backup

CurrentPath=”/globalshare/current/Server01″
ArchivePath=”/globalshare/archive/Server01″
LocalPath=”/backup”

log=/home/oracle/scripts/delete_old_files.log
err=/home/oracle/scripts/delete_old_files.err

# Use mmin variable for file modified timestamp & cmin for file creation

# Delete from Archive Directory
# 14 days = 336 hours = 336*60 = 20160
find $ArchivePath -type f -mmin +20160 -exec rm -f {} \; 1>>${log} 2>>${err}
echo “Archive File Deletion (Files Older than 14 days) finished on : ” `date` >>${log}

# Delete from Current Directory
# 36 hours = 36*60 = 2160
find $CurrentPath -type f -mmin +2160 -exec rm -f {} \; 1>>${log} 2>>${err}
echo “Current File Deletion (Files Older than 3 days) finished on : ” `date` >>${log}
exit

Shell Script : Copy files from local folder to a Samba/NFS share

Posted by Sagar Patil

#!/bin/bash
source=”/backup”
remotePath=”/globalbackup/current”
archivePath=”/globalbackup/archive”
log=/home/oracle/scripts/cp_to_share.log
err=/home/oracle/scripts/cp_to_share.err

# I am going to rename files with timestamp so old shell files are preserved for future reference
timestamp=`date +%Y-%m-%d-%H%M`

#Move the shell file cp_to_share.sh
mv -f /home/oracle/scripts/cp_to_share.sh /home/oracle/scripts/cp_to_share.sh$timestamp
mv $log $log$timestamp
mv $err $err$timestamp

echo “### Let’s Move files copied y’day from remotePath to archivePath” >> /home/oracle/scripts/cp_to_share.sh

# Let’s Move files copied y’day from remotePath to archivePath
list=`find $remotePath -mtime -1 -type f`

for i in $list
do
echo “mv -f $i $archivePath” >> /home/oracle/scripts/cp_to_share.sh
done

echo “” >> /home/oracle/scripts/cp_to_share.sh

echo “### Let’s start copying files at the global share” >> /home/oracle/scripts/cp_to_share.sh

# Copy files at the global share
list=`find /backup/ablxpora01/rman -mtime -1 -type f`
timestamp=`date +%Y-%m-%d-%H%M`

for i in $list
do
echo “cp $i $remotePath” >> /home/oracle/scripts/cp_to_share.sh
done
chmod +x /home/oracle/scripts/cp_to_share.sh
sh /home/oracle/scripts/cp_to_share.sh 1>>${log} 2>>${err}

Top of Page

Top menu