Websphere : Plug-in Workload Management Failover

Posted by Sagar Patil

We have a 2 node clustered websphere 6.x vertical cluster . Number of times we see the system going down and coming back up in less than 5 mins.

Investigation:

Websphere  uses SESSIONID to divert user sessions to relevant JVMs . Plug-in polling interval keeps track of status of JVMs (up/down/hung).  Under situation we had, HTTP plug-in should direct user session to another JVM (JVM2 here) . But I think it didn’t .  To do so, we need to configure parameter “ConnectTimeout”  to force it to look for another server.

“ConnectTimeout” makes plug-in use a non-smoking connect.
Setting ConnectTimeout to a value of zero (default here) is equal to not specifying ConnectTimeout attribute, that is, the plug-in performs a blocking connect and waits until the operating system times out  (For Linux it can take up to 5-10 minutes for the Socket to time-out).
ConnectTimeout
The ConnectTimeout attribute of a Server element enables the HTTP plug-in to perform non-blocking connections with a backend cluster member. Non-blocking connections are beneficial when the HTTP plug-in is unable to contact the destination to determine if the port is available or unavailable for a particular cluster member.

If no ConnectTimeout value is specified, the HTTP plug-in performs a blocking connect in which the HTTP plug-in sits until an operating system TCP timeout occurs (as long as 2 minutes depending on the platform) and allows the HTTP plug-in to mark the cluster member unavailable. A value of 0 causes the HTTP plug-in to perform a blocking connect. A value greater than 0 specifies the number of seconds you want the HTTP plug-in to wait for a successful connection. If a connection does not occur after that time interval, the HTTP plug-in marks the cluster member unavailable and fails over to one of the other cluster members defined in the cluster. 

Caution: In an environment with busy workload or a slow network connection, setting this value too low could make the HTTP plug-in mark a cluster member down falsely. Therefore, caution should be used whenever choosing a value for ConnectTimeout.

Set attribute “ConnectTimeout” to an integer value greater than zero to determine how long plug-in should wait for a response when attempting to connect to a server.  A setting of 15 means that the plug-in waits for 15 seconds to time out than 5-10 minutes thru OS settings.

<Server CloneID="10k66djk2" ConnectTimeout="10" ExtendedHandshake="false" LoadBalanceWeight="1000" MaxConnections="0" Name="Server1_WebSphere_Appserver" WaitForContinue="false">
<Transport Hostname="server1.domain.com" Port="9091" Protocol="http"/>
</Server>

Websphere : Installing default Applications

Posted by Sagar Patil

After successful websphere install one will see “first steps” page as below.

Click on “Samples Gallery” which should pop up an html page with list of application samples

Naviagte to $WAS_HOME/samples and run install.bat (Windows) else install.sh (linux).

This script will install number of default applications listed below

“Startup” applications by selecting application & clicking on “start” option at Deployment Manager. Once done visit following URL and explore apps you wish

Websphere: Purging first failure data capture log files

Posted by Sagar Patil

The first failure data capture (FFDC) feature preserves the information that is generated from a processing failure and returns control to the affected engines. The captured data is saved in a log file for analyzing the problem. FFDC is intended primarily for use by IBM Service.

Use following steps to configure number of days between FFDC log file purges. The value is in days.

The FFDC file management function removes the FFDC log files that have reached the maximum age and generates a message in the SystemOut.log file.

Procedure :

  1. Open the ffdcRun.properties file. The file is located in the $WAS_ROOT/properties  directory
  2. Change the value for the ExceptionFileMaximumAge property to the number of days between the FFDC log file purges. The value of the ExceptionFileMaximumAge property must be a positive number. The default is seven days. For example, ExceptionFileMaximumAge = 3 sets the default time to three days. The FFDC log file is purged after three days
  3. Save the ffdcRun.properties file and exit
  4. Repeat the previous steps to modify the ffdcStart.properties and ffdcStop.properties files

Jython Scripts for Websphere Administration

Posted by Sagar Patil

Download them from  http://www.ibm.com/developerworks/websphere/library/samples/SampleScripts.html

ex1.py  – Create and modify a server, load an application onto the server, and start the server.
ex2.py  – Reverse of ex1.p1 Stop a server on a given node, uninstalls the given application, and removes the server from the configuration.
ex3.py  – Creates a cluster and starts the server
ex4.py  – Demonstrate the invocation of some useful problem
determination actions involving traces and thread dumps.
ex5.py  – Demonstrate the invocation of various application install commands.
ex6.py  – Produce a short summary of some configuration and runtime information about the WebSphere installation.
ex7.py  – Create a JDBCProvider object using a template.
ex8.py  – Demonstrate J2C Security configuration, including the installation of a J2CResourceAdapter and creation of a J2CConnectionFactory.
ex9.py  – Demonstrate the creation of a JDBCProvider, DataSource and CMPConnectorFactory objects
ex10.py – Demonstrate the creation and use of a variable that is used in the creation of a URLProvider object.
ex11.py – Demonstrate the setting of various port numbers
ex12.py – Demonstrate methods for updating configuration attributes that are lists

Websphere: startManager.sh doesn't work while startServer.sh does

Posted by Sagar Patil

[Dmgr]$ /opt/IBM/WebSphere/AppServer/profiles/Profile/Dmgr/bin/startManager.sh

ADMU0116I: Tool information is being logged in file
/opt/IBM/WebSphere/AppServer/profiles/Profile/Dmgr/logs/dmgr/startServer.log
ADMU0128I: Starting tool with the Dmgr profile
ADMU3100I: Reading configuration for server: dmgr
ADMU0111E: Program exiting with error: java.io.FileNotFoundException:
/opt/IBM/WebSphere/AppServer/profiles/Profile/Dmgr/config/cells/Cell/nodes/Manager/servers/dmgr/server.xml
(No such file or directory)
ADMU1211I: To obtain a full trace of the failure, use the -trace option.
ADMU0211I: Error details may be seen in the file:
/opt/IBM/WebSphere/AppServer/profiles/Profile/Dmgr/logs/dmgr/startServer.log

Log /opt/IBM/WebSphere/AppServer/profiles/Profile/Dmgr/logs/dmgr/startServer.log has tonnes of errors

[10/12/10 7:14:19:045 BST] 0000000a AdminTool     A   ADMU0111E: Program exiting with error: java.io.FileNotFoundException:
/opt/IBM/WebSphere/AppServer/profiles/Profile/Dmgr/config/cells/Cell/nodes/Manager/servers/dmgr/server.xml (No such file or directory)
at java.io.FileInputStream.<init>(FileInputStream.java:135)
at org.eclipse.emf.ecore.resource.impl.URIConverterImpl.createFileInputStream(URIConverterImpl.java:469)
at org.eclipse.emf.ecore.resource.impl.URIConverterImpl.createInputStream(URIConverterImpl.java:431)
at org.eclipse.emf.ecore.resource.impl.ResourceImpl.load(ResourceImpl.java:897)
at org.eclipse.wst.common.internal.emf.resource.CompatibilityXMIResourceImpl.load(CompatibilityXMIResourceImpl.java:259)
at com.ibm.websphere.resource.WASResourceImpl.load(WASResourceImpl.java:61)
at org.eclipse.emf.ecore.resource.impl.ResourceSetImpl.demandLoad(ResourceSetImpl.java:249)
at org.eclipse.emf.ecore.resource.impl.ResourceSetImpl.demandLoadHelper(ResourceSetImpl.java:264)
at org.eclipse.emf.ecore.resource.impl.ResourceSetImpl.getResource(ResourceSetImpl.java:390)
at com.ibm.websphere.resource.WASResourceSetImpl.getResource(WASResourceSetImpl.java:158)
at com.ibm.websphere.resource.WASResourceSetImpl.getResource(WASResourceSetImpl.java:143)
at com.ibm.ws.runtime.service.ConfigRootImpl.getResource(ConfigRootImpl.java:326)
at com.ibm.ws.runtime.service.ConfigRootImpl.getResource(ConfigRootImpl.java:299)
at com.ibm.ws.runtime.service.ConfigRootImpl.getResource(ConfigRootImpl.java:275)
at com.ibm.ws.management.tools.WsServerLauncher.initializeRepositoryAndLauncher(WsServerLauncher.java:397)
at com.ibm.ws.management.tools.WsServerLauncher.runTool(WsServerLauncher.java:265)
at com.ibm.ws.management.tools.AdminTool.executeUtility(AdminTool.java:264)
at com.ibm.ws.management.tools.WsServerLauncher.main(WsServerLauncher.java:120)
at sun.reflect.NativeMethodAccessorImpl.invoke0(Native Method)
at sun.reflect.NativeMethodAccessorImpl.invoke(NativeMethodAccessorImpl.java:79)
at sun.reflect.DelegatingMethodAccessorImpl.invoke(DelegatingMethodAccessorImpl.java:43)
at java.lang.reflect.Method.invoke(Method.java:618)
at com.ibm.ws.bootstrap.WSLauncher.main(WSLauncher.java:263)

System doesn’t have  “/opt/IBM/WebSphere/AppServer/profiles/Profile/Dmgr/config/cells/Cell/nodes/Manager/servers/dmgr/server.xml” but have
“/opt/IBM/WebSphere/AppServer/profiles/Profile/Dmgr/config/cells/Cell/nodes/Manager/servers/Dmgr/server.xml”

StartServer Dmgr command works fine. Note it’s “Dmgr” instead of “dmgr” here

$ /opt/IBM/WebSphere/AppServer/profiles/Profile/Dmgr/bin/startServer.sh Dmgr
ADMU0116I: Tool information is being logged in file
/opt/IBM/WebSphere/AppServer/profiles/Profile/Dmgr/logs/Dmgr/startServer.log
ADMU0128I: Starting tool with the Dmgr profile
ADMU3100I: Reading configuration for server: Dmgr
ADMU3200I: Server launched. Waiting for initialization status.
ADMU3000I: Server Dmgr open for e-business; process id is 2264

$pwd
/opt/IBM/WebSphere/AppServer/profiles/Profile

[Profile]$ ls -lrt
drwxr-xr-x 17 was61 web  12288 Sep 27 08:28 Node
drwxr-xr-x 18 was61 web   4096 Jul  4  2011 Dmgr

Solution :

Edit “/opt/IBM/WebSphere/AppServer/bin/startManager.sh” and alter D_DMGR from dmgr to Dmgr

#Common args…
D_DMGR=”dmgr” changed to “Dmgr”
D_ARGS=”-Dws.ext.dirs=”$WAS_EXT_DIRS” $DELIM -Dwas.install.root=”$WAS_HOME” $DELIM -Djava.util.logging.manager=com.ibm.ws.bootstrap.WsLogManager $DELIM -Djava.util.logging.configureByServer=true”

Edit “/opt/IBM/WebSphere/AppServer/bin/stopManager.sh” and alter line 126

$SHELL “$CONFIG_ROOT” “$WAS_CELL” “$WAS_NODE” dmgr -dmgr “$@”
to
$SHELL “$CONFIG_ROOT” “$WAS_CELL” “$WAS_NODE” Dmgr -dmgr “$@”

Installing application(EAR/WAR) thru wsadmin

Posted by Sagar Patil

The isAppReady command returns a value of true if the system is ready to start the application, or a value of false if the system is not ready to start the application, as the following examples display:

[was61@waslogs]$ /opt/IBM/WebSphere/AppServer/profiles/Profile01/dmgr/bin/wsadmin.sh -conntype SOAP -lang jython
WASX7209I: Connected to process “dmgr” on node Prod_Node_Manager using SOAP connector;  The type of process is: DeploymentManagerWASX7031I: For help, enter: “print Help.help()”
wsadmin>AdminApp.isAppReady(‘application1’);

ADMA5071I: Distribution status check started for application prpc_j2ee14.
WebSphere:cell=Prod_Node_Cell,node=Prod_Node_Node01,distribution=true,expansion=notprocessing
ADMA5011I: The cleanup of the temp directory for application prpc_j2ee14 is complete.
ADMA5072I: Distribution status check completed for application prpc_j2ee14.
‘true’

getDeployStatus command to display additional information about the binary file expansion status, as the following examples display:

[was61@Prod_Node waslogs]$ /opt/IBM/WebSphere/AppServer/profiles/Profile01/dmgr/bin/wsadmin.sh -conntype SOAP -lang jython
WASX7209I: Connected to process “dmgr” on node Prod_Node_Manager using SOAP connector;  The type of process is: DeploymentManager
wsadmin>AdminApp.getDeployStatus(‘application1’);
ADMA5071I: Distribution status check started for application application.
WebSphere:cell=Prod_Node_Cell,node=Prod_Node_Node01,distribution=true,expansion=notprocessing
ADMA5011I: The cleanup of the temp directory for application application is complete.
ADMA5072I: Distribution status check completed for application application.
‘WebSphere:cell=Prod_Node_Cell,node=Prod_Node_Node01,distribution=true,expansion=notprocessing’

Let’s deploy an Application called “application1″

1. wsadmin>AdminApp.update(‘application1’, ‘app’, ‘[-operation update -contents /tmp/Application1.ear -usedefaultbindings -nodeployejb ]’);

ADMA0073W: Custom permissions are found in the [(com.ibm.websphere.security.WebSphereRuntimePermission AdminPermission), (com.ibm.oti.shared.SharedClassPermission

// One cannot grant permissions to code outside of the deployed application via the WAS policy
ADMA5017I: Uninstallation of Application1 started.
ADMA5104I: The server index entry for WebSphere:cell=server_Cell,node=server_Node01 is updated successfully.
ADMA5106I: Application Application1 uninstalled successfully.
ADMA5016I: Installation of Application1 started.
ADMA5001I: The application binaries are saved in /opt/IBM/WebSphere/AppServer/profiles/Profile01/dmgr/wstemp/Script12b3ee78983/workspace/cells/server_Cell/applications/Application1.ear/Application1.ear
ADMA5005I: The application Application1 is configured in the WebSphere Application Server repository.
SECJ0400I: Successfuly updated the application Application1 with the appContextIDForSecurity information.
ADMA5011I: The cleanup of the temp directory for application Application1 is complete.
ADMA5013I: Application Application1 installed successfully.

2. wsadmin>AdminConfig.save();


wsadmin>AdminApp.update(‘prpc_j2ee14’, ‘app’, ‘[-operation update -contents /tmp/prpc_j2ee14.ear -usedefaultbindings -nodeployejb ]’);
ADMA0073W: Custom permissions are found in the [(com.ibm.websphere.security.WebSphereRuntimePermission AdminPermission), (com.ibm.oti.shared.SharedClassPermission com.pega.pegarules.internal.bootstrap.PRBaseLoader read,write), (com.ibm.oti.shared.SharedClassPermission com.pega.pegarules.bootstrap.loader.PRAppLoader read,write), (com.ibm.oti.shared.SharedClassPermission com.pega.jasper.PegaURLClassLoader read,write), (com.ibm.websphere.security.WebSphereRuntimePermission accessRuntimeClasses)] policy file. Custom permissions can compromise the integrity of Java 2 Security.
WASX7327I: Contents of was.policy file:
// was.policy
// $Id: was.policy,v 1.1.4.1 2008/05/16 19:26:53 olsok Exp $
// ============================================================================
// 16-May-08    olsok           Bug-14175       always enable SharedClassPermission
//                                                                              enable ManagementPermission for JVM memory monitoring
// 08-Jun-07    olsok           Code-323        update for PegaRULES 5.4
// 15-Nov-05    ablal           R-18775         moved moved connectorComponent permissions into ra1-5.xml
//                                                                              after installing WS 6.0.2.3
// 14-Sep-05    GajnJ                                   Add write/delete privileges for the root temp dir
// 15-Aug-05    olsok           R-18694         adapt for WebSphere 6.0.2
// 12-Aug-05    olsok           R-18694         adjusted based on classloader changes
// 11-Aug-05    olsok           R-18694         configure PegaRULES permissions

// The PegaRULES polices coded in this file assume that the PegaRULES
// application is deployed as a standard ear file in the standard WebSphere
// location.
//
// PegaRULES policies use the following variables that should be supplied
// as Java system properties at runtime:
//              java.home                               (Standard Java property)
//              java.io.tmpdir                  (Standard Java property)
//              user.home                               (Standard Java property)
//              was.install.root                (Standard WebSphere property)
//              was.module.path                 (Standard WebSphere embedded symbol)
//              app.installed.path              (Standard WebSphere embedded symbol)
//              pega.tmpdir                             path to writable temp directory that PegaRULES
//                                                              should use (as specified in prconfig.xml), using
//                                                              host-specific path delimiters

// ========================================================================================
// PegaRULES V5.4 configuration follows (08-Jun-2007)
// (assumes use of jdbc drivers supplied by WebSphere)

// Note – with PegaRULES 5.4, must use “application” rather than “jars”.
grant codebase “file:${application}” {
// the following needed to resolve host ip address – these permissions
// are automatically provided by WebSphere even if not listed here
//permission java.net.SocketPermission “localhost:1024-“, “listen,resolve”;
//permission java.net.SocketPermission “*”, “connect,resolve”;

// the following needed to access properties that control startup and configuration
permission java.util.PropertyPermission “*”, “read,write”;

// the following needed for MBean support
permission com.ibm.websphere.security.WebSphereRuntimePermission “AdminPermission”;
permission javax.management.MBeanTrustPermission “register”;
permission javax.management.MBeanServerPermission “findMBeanServer”;
permission javax.management.MBeanPermission “*#*[]”, “queryNames”;
permission javax.management.MBeanPermission “com.pega.*#*[]”, “registerMBean”;
permission javax.management.MBeanPermission “com.pega.*#*[]”, “isInstanceOf”;
permission javax.management.MBeanPermission “com.pega.*#*[]”, “getMBeanInfo”;
permission javax.management.MBeanPermission “com.pega.*#*[]”, “unregisterMBean”;
permission javax.management.MBeanPermission “com.pega.*#*[]”, “addNotificationListener”;

// the following needed to monitor JVM events for low memory alerts / tracebacks
permission java.lang.management.ManagementPermission “control”;

// the following permissions may be granted to PRBaseLoader, PRAppLoader and other URL-based classloaders within PegaRULES to
// avoid a security exception being reported in the console log when the respective classloader constructor is invoked. The
// PRBaseLoader and PRAppLoader are explicitly coded to avoid class sharing via this mechanism in the IBM JVM but there is
// no mechanism provided by IBM for programatically disabling the use of shared classes in a classloader that
// extends URLClassLoader.
permission com.ibm.oti.shared.SharedClassPermission “com.pega.pegarules.internal.bootstrap.PRBaseLoader”, “read,write”;
permission com.ibm.oti.shared.SharedClassPermission “com.pega.pegarules.bootstrap.loader.PRAppLoader”, “read,write”;
// Be sure to grant the permission to the classloader used within Jasper – a new instance of this classloader is
// created for each stream, and the lack of the shared class permission will fill the log file with security exceptions
permission com.ibm.oti.shared.SharedClassPermission “com.pega.jasper.PegaURLClassLoader”, “read,write”;

// the following needed by PRBaseLoader, PRAppLoader and other classloaders within PegaRULES
permission java.lang.reflect.ReflectPermission “suppressAccessChecks”;
permission java.util.logging.LoggingPermission “control”;
permission java.lang.RuntimePermission “createClassLoader”;
permission java.lang.RuntimePermission “accessDeclaredMembers”;
permission java.lang.RuntimePermission “getClassLoader”;
permission java.lang.RuntimePermission “getProtectionDomain”;
permission java.security.SecurityPermission “getPolicy”;
permission java.lang.RuntimePermission “accessClassInPackage.sun.util.logging.resources”;

// the following needed by Jasper and PegaRULES classloaders
permission java.lang.RuntimePermission “setContextClassLoader”;

// the following needed by Jasper
permission java.lang.RuntimePermission “setIO”;

// the following needed by performance timers
permission java.lang.RuntimePermission “accessClassInPackage.sun.misc”;         // when using Java 5 management APIs
permission java.lang.RuntimePermission “sun.misc.Perf.getPerf”;
// (WebSphere will not substitute app.installed.path in a RuntimePermission, only a FilePermission
// so the permission grant to load the library cannot be restricted to the single library we require.)
permission java.lang.RuntimePermission “loadLibrary.*”;
//permission java.lang.RuntimePermission “loadLibrary.${app.installed.path}${/}APP-INF${/}binredist${/}x86${/}pr3native.dll”;
//permission java.lang.RuntimePermission “loadLibrary.${app.installed.path}${/}APP-INF${/}binredist${/}ppc${/}pr3native.so”;
//permission java.lang.RuntimePermission “loadLibrary.${app.installed.path}${/}APP-INF${/}binredist${/}sparc${/}pr3native.so”;

// the following needed by LibraryUtil
permission java.lang.RuntimePermission “accessClassInPackage.sun.reflect”;

// the following needed by Log4J asynch appenders and resource adapter timer thread
permission java.lang.RuntimePermission “modifyThreadGroup”;
permission java.lang.RuntimePermission “modifyThread”;

// the following needed for server identification display
permission com.ibm.websphere.security.WebSphereRuntimePermission “accessRuntimeClasses”;
permission java.io.FilePermission “${was.install.root}”, “read”;
permission java.io.FilePermission “${was.install.root}${/}-“, “read”;

// WebSphere establishes a protection domain based on the jar file in which the
// class performing the operation resides, and does not grant permission to
// read other jar files under the deployment. The following addresses that issue.
permission java.io.FilePermission “${app.installed.path}${/}-“, “read”;                 // IMPLIED by was.install.root read permission

// the following needed to probe for user-specific prconfig/prlogging files
permission java.io.FilePermission “${user.home}${/}*”, “read”;

// the following needed for access to relocated temp and root directories
permission java.io.FilePermission “${pega.tmpdir}”, “read,write,delete”;
permission java.io.FilePermission “${pega.tmpdir}${/}-“, “read,write,delete”;

// the following needed for WebSphere SQL/Server jdbc drivers
permission java.io.FilePermission “${java.io.tmpdir}${/}-“, “read,write,delete”;

// the following needed for the embedded Eclipse compiler — IMPLIED by was.install.root read permission provided that java.home is under was.install.root
//permission java.io.FilePermission “${java.home}”, “read”;
//permission java.io.FilePermission “${java.home}${/}-“, “read”;

// needed when using container managed security
permission javax.security.auth.AuthPermission “getSubject”;

};

// One cannot grant permissions to code outside of the deployed application via the WAS policy
// file. PRClassLoader uses a set of hard-coded permissions for all (assembled/generated) code
// loaded by it.

ADMA5017I: Uninstallation of prpc_j2ee14 started.
ADMA5104I: The server index entry for WebSphere:cell=eugbbopg03lt_Cell,node=eugbbopg03lt_Node01 is updated successfully.
ADMA5102I: The configuration data for prpc_j2ee14 from the configuration repository is deleted successfully.
ADMA5011I: The cleanup of the temp directory for application prpc_j2ee14 is complete.
ADMA5106I: Application prpc_j2ee14 uninstalled successfully.
ADMA5016I: Installation of prpc_j2ee14 started.
ADMA5058I: Application and module versions are validated with versions of deployment targets.
ADMA5005I: The application prpc_j2ee14 is configured in the WebSphere Application Server repository.
ADMA5053I: The library references for the installed optional package are created.
ADMA5005I: The application prpc_j2ee14 is configured in the WebSphere Application Server repository.
ADMA5001I: The application binaries are saved in /opt/IBM/WebSphere/AppServer/profiles/Profile01/dmgr/wstemp/Script12b3ee78983/workspace/cells/eugbbopg03lt_Cell/applications/prpc_j2ee14.ear/prpc_j2ee14.ear
ADMA5005I: The application prpc_j2ee14 is configured in the WebSphere Application Server repository.
SECJ0400I: Successfuly updated the application prpc_j2ee14 with the appContextIDForSecurity information.
ADMA5011I: The cleanup of the temp directory for application prpc_j2ee14 is complete.
ADMA5013I: Application prpc_j2ee14 installed successfully.

wsadmin>AdminConfig.save();

Compare Websphere Configuration Details : Visual Configuration Explorer (VCE)

Posted by Sagar Patil

I have many websphere 6.x ND clustered servers and growing every single week. Lots of them are upgraded from previous websphere installations to ND 6.x now.

We have admin shell scripts written but they are not portable.  There is diff in naming conventions for profile, Cluster name, Application Server name etc. We have some issues and they all point to diff in configuration settings.

Recently I came across tool called “Visual Configuration Explorer (VCE)”.

Here is a forum for discussions related to this tool:
http://www.ibm.com/developerworks/forums/forum.jspa?forumID=1139

Getting Started with Visual Configuration Explorer

Download the Workbench component of ISA Version 4.0 for Windows via the following URL:
http://www.ibm.com/software/support/isa/

You may want to go thru this excellent ppt file about IBM Support assistant

http://www.oracledbasupport.co.uk/wp-content/uploads/2010/09/Headless_Help.txt
http://www.oracledbasupport.co.uk/wp-content/uploads/2010/09/VCEHeadlessRuntimeReadme-1.txt

Websphere : Change application server ports

Posted by Sagar Patil

I have set of JVM ports (9080,9081) accessible thru firewall.  This week when I built new websphere clustered ND environment something went wrong and it picked up ports 9081,9082 instead of usual 9080,9081. Here is a process I used to alter them from 9081->9080 & 9082->9081

Login at deployment manager -> Sselect Servers -> Application Servers -> Server1 -> Scroll down at right  hand pane until Communications and select “Ports”


Click on Details and edit both port numbers 9081/9444


Finally generate and propagate plugin to reflect new port changes at IBM Http server “plugin-cfg.xml”

Old Plugin-cfg.xml Settings :

<ServerCluster CloneSeparatorChange=”false” GetDWLMTable=”false” IgnoreAffinityRequests=”true” LoadBalance=”Round Robin” Name=”cluster” PostBufferSize=”64″ PostSizeLimit=”-1″ RemoveSpecialHeaders=”true” RetryInterval=”60″>
<Server CloneID=”15a4r5p9p” ConnectTimeout=”0″ ExtendedHandshake=”false” LoadBalanceWeight=”2″ MaxConnections=”-1″ Name=”Server1_Node01_server_member1″ ServerIOTimeout=”0″ WaitForContinue=”false”>
<Transport Hostname=”Server1″ Port=”9081” Protocol=”http”/>
<Transport Hostname=”Server1″ Port=”9444” Protocol=”https”>
<Property Name=”keyring” Value=”/opt/IBM/WebSphere/Plugins/config/ihs-prpc/plugin-key.kdb”/>
<Property Name=”stashfile” Value=”/opt/IBM/WebSphere/Plugins/config/ihs-prpc/plugin-key.sth”/>
</Transport>
</Server>

Open /opt/IBM/WebSphere/Plugins/config/ihs-prpc/plugin-cfg.xml and make sure you see the new port changes

<ServerCluster CloneSeparatorChange=”false” GetDWLMTable=”false” IgnoreAffinityRequests=”true” LoadBalance=”Round Robin” Name=”cluster” PostBufferSize=”64″ PostSizeLimit=”-1″ RemoveSpecialHeaders=”true” RetryInterval=”60″>
<Server CloneID=”15a4r5p9p” ConnectTimeout=”0″ ExtendedHandshake=”false” LoadBalanceWeight=”2″ MaxConnections=”-1″ Name=”Server1_Node01_server_member1″ ServerIOTimeout=”0″ WaitForContinue=”false”>
<Transport Hostname=”Server1″ Port=”9080” Protocol=”http”/>
<Transport Hostname=”Server1″ Port=”9443” Protocol=”https”>
<Property Name=”keyring” Value=”/opt/IBM/WebSphere/Plugins/config/ihs-prpc/plugin-key.kdb”/>
<Property Name=”stashfile” Value=”/opt/IBM/WebSphere/Plugins/config/ihs-prpc/plugin-key.sth”/>
</Transport>
</Server>

Websphere : How to change HOSTNAME using ws_ant scripts

Posted by Sagar Patil

Today I have a new_server which I need to build to my websphere old_server.  The first thing to do is rename Hostname from old_server to new_server. Here is a script I used  to just do that.

Download “Configuration management scripts for V6 ConfigScripts.zip” from  http://www.ibm.com/developerworks/websphere/library/samples/SampleScripts.html

Sample exportImport.xml attached here http://www.oracledbasupport.co.uk/wp-content/uploads/2010/08/exportImport.xml

[websphere@new_server config_management]$ /opt/IBM/WebSphere/AppServer/bin/ws_ant.sh -profileName dmgr -buildfile exportImport.xml -DstartManager=yes -DoldHostName=old_server -DnewHostName=new_server change  HostName
Buildfile: exportImport.xml

checkRelease:
[wsadmin] WASX7357I: By request, this scripting client is not connected to any server process. Certain configuration and application operations will be available in local mode.
[wsadmin] Executing ValidateRelease.jacl script
[wsadmin] List of Node is new_server_Manager(cells/old_server_Cell/nodes/old_server_Manager|node.xml#Node_1)
[wsadmin] old_server_Node01(cells/old_server_Cell/nodes/old_server_Node01|node.xml#Node_1)

checkNewHost:
checkOldHost:

changeHostName:
[echo] Was Home is /opt/IBM/WebSphere/AppServer
[echo] User Install Root is /opt/IBM/WebSphere/AppServer/profiles/Profile01/dmgr
[echo] Config Root is /opt/IBM/WebSphere/AppServer/profiles/Profile01/dmgr/config
[echo] Cell name is old_server_Cell
[echo] Node name is old_server_Manager

changeServerIndexConfig:
[echo] Modifying serverindex.xml from old_server to new_server

changeHNServerConfig:
[echo] Modifying server.xml from old_server to new_server

changeWsadminProp:
[echo] Modifying wsadmin.properties from old_server to new_server

startManager:

doStartManager:
[exec] ADMU0116I: Tool information is being logged in file
[exec]            /opt/IBM/WebSphere/AppServer/profiles/Profile01/dmgr/logs/dmgr/startServer.log
[exec] ADMU0128I: Starting tool with the dmgr profile
[exec] ADMU3100I: Reading configuration for server: dmgr
[exec] ADMU3200I: Server launched. Waiting for initialization status.
[exec] ADMU3000I: Server dmgr open for e-business; process id is 22554

BUILD SUCCESSFUL
Total time: 28 seconds
[websphere@new_server config_management]$ ps -ef | grep java

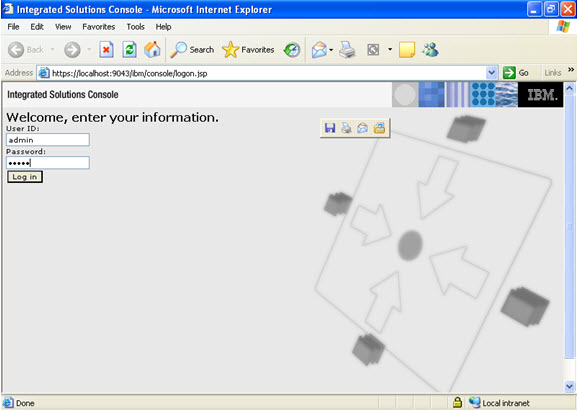
Now let’s connect to the new DMGR using URL  https://new_node:9043/ibm/console/ . I could connect successfully with username /pwd as of old_server

Time Travel & Websphere Node/Deployment manager synchronisation

Posted by Sagar Patil

I have websphere 6.x ND servers which time travel in future i.e 2011/2012.  One of machine time traveled to 2011, I then had to revert it back to current date i.e 2010. I can now see that configuration under following directories is not updated properly.

DMGR : Aug 5 2010 is the latest.

[was@Server1 Profile01]$ ls -l profiles/Profile01/dmgr/config/cells/Server1_Cell/nodes/Server1_Node01
total 136
-rw-rw-r– 1 was was   818 Aug  5 16:23 trust.p12
-rw-rw-r– 1 was was  3474 Aug  5 16:23 key.p12
-rw-rw-r– 1 was was 12552 Aug  3 13:24 serverindex.xml

[was@Server1 ~]$ ls -lrt profiles/Profile01/Node/config/cells/Server1_Cell/nodes/Server1_Node01
total 136
-rw-rw-r– 1 was was  2042 Aug 13  2011 trust.p12
-rw-rw-r– 1 was was  2770 Aug 13  2011 key.p12
-rw-rw-r– 1 was was 12552 Aug 15  2011 serverindex.xml

How does Deployment manager syncs Nodes with it’s new configuration?

In order for synchronization to work, the system clocks of the Deployment Manager, and Node Agent machines must be within a specific time range. Otherwise, the attempt to synchronize will fail, and you will get a message indicating that the time difference is too great.

If you have more than 5 min difference between dmgr and node. And you have admin security enabled. Then you will see LTPA token expiration errors…. While communicating with the Deployment Manager, the Node agent for example sync or discover process.

Where will I get this error message?

Yes.  The Deployment Manager is the one that attempts the synchronization with the node agents, so the status messages (i.e., success/failure) would be in the DM logs.

I often get too many file entries left at wstemp and temp directories under NodeAgent/Dmgr. They are failed sync files and would like to know if I can delete them.

WebSphere Application Server and config temp files

  • The node sends a sync request to cell (dmgr)
  • The cell manager identifies the modified documents, copies them to the temp folder (config/temp) and then sends the response to node with the URLs of modified documents.
  • The node then uses the File Transfer service to download the documents to local machine.
  • The file transfer service internally sets a flag that enables the file transfer server to delete the temp file once the download is complete.

Whenever there is a request to transfer a file, the dmgr creates a temp copy in the config/temp directory. <Install_Root>\config\temp\cells\<cell_name>\applications\ .

  • The dmgr deletes the temp copy only when the file is completely read and copied to the client.
  • The temp files get deleted only when the download process is complete and successful.

Why does dmgr/nodeagent use temp directories? Is there any reason for it?

The wstemp directory is where workspaces (save areas) are created when someone begins the process of changing a configuration in a node.
The wstemp directory is the workspace directory.  Any program that ask the workspace for a session (e.g. adminconsole and wsadmin)  a directory will be created.  If the session is not cleaned up
the directories will remain.  For wsadmin, the completion of wsadmin will clean the directory, note if you kill or wsadmin fails to work and crash, the folder will remain (these have script in the folder
name).

For adminconsole, each user will have their own folder. These folders will always remain because we maintain user preference during their sessions.  Also if the user does not logout, we keeps all configuration changes in this folder.  Once they log out, the user folder will be reduced to contain the minimum preference information for the next session login. You can remove all these files/folders and the dmgr will create new files (we highly recommmend stopping the dmgr before deleting these so users logged in don’t have errors).

These folders contain temporary files and can be manually deleted.  Websphere will automatically manage these files and if they are growing later, something is wrong because users are killing/not logging out.

Hers is a reference document which helps to understand and to debug the problems with wstemp workspace directories which contains workspace  directories named with ‘anonymousxxxx’ and ‘ Scriptxxxx’ .

Problem with workspace directories when created in wstemp directory
http://www-1.ibm.com/support/docview.wss?uid=swg21221297

More reading

IBM – WebSphere Application Server synchronization process explained
http://www-01.ibm.com/support/docview.wss?rs=180&uid=swg21233075

IBM – What is file synchronization and how does it work?
http://www-01.ibm.com/support/docview.wss?rs=180&uid=swg21108407

Creating Users /Groups at Websphere

Posted by Sagar Patil

We have to create WAS groups before creating & assigning users.

Click on Manage groups and add a new groups , here “WAS Monitor”


Click on “Save “


Click on “Create” at  right hand pane & you will see a FORM like one below

Click on “Group Membership” and select WAS Operator role we just created.


Now refer to following post for stopping  and starting  websphere services
http://www.oracledbasupport.co.uk/websphere-security-switch-off-usernamepassword-prompt/#comment-2905

Websphere ND Install under Windows :Create DMGR, AppServer profile

Posted by Sagar Patil

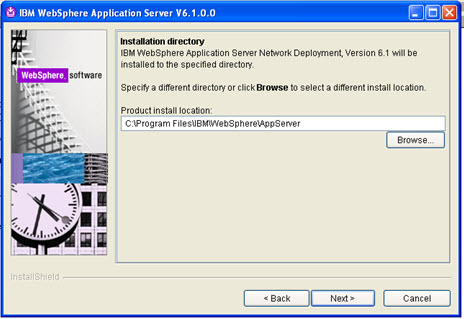
Let’s start network deployment install, Click on the launchpad.exe

Next

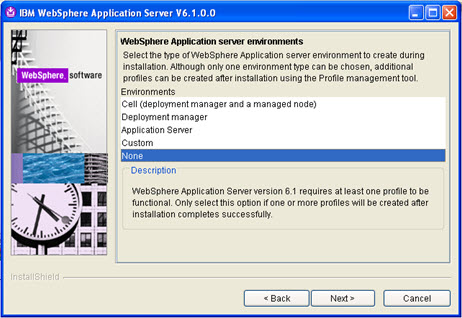
Select none. Installation carries on…..

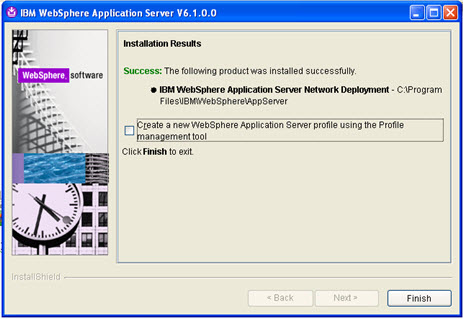
Uncheck the check box as shown in the following figure. And you will be able to create the deployment manager profile using Profile creation tool.

To open the profile creation tool from the command prompt

D:\Program Files\IBM\WebSphere\AppServer\bin\ProfileManagement/pmt


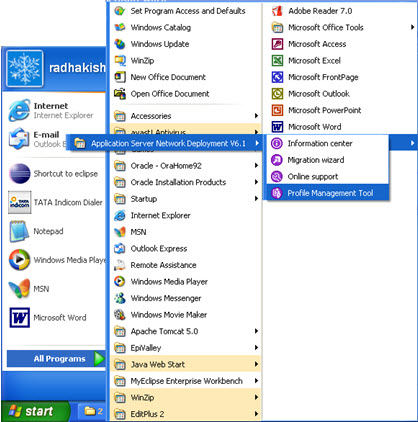
2. Go to program files and profile management tool as follows:

And create a deployment manager profile first.

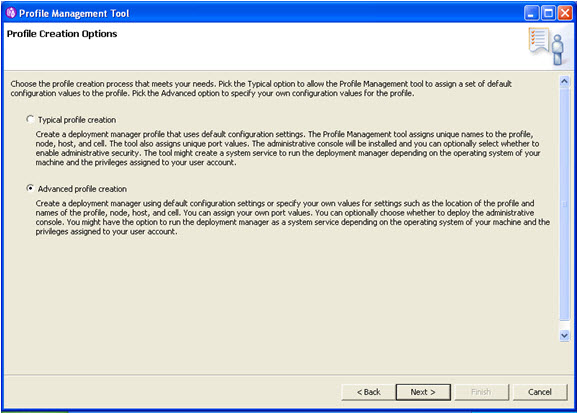
Select advanced profile creation.

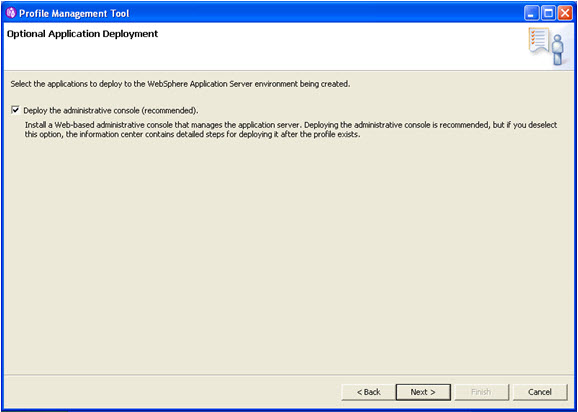
Select deploy administration console and click on next.

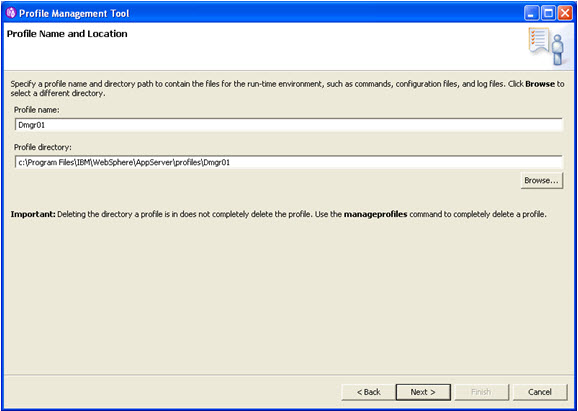
Specify profile name and directory and click on next.

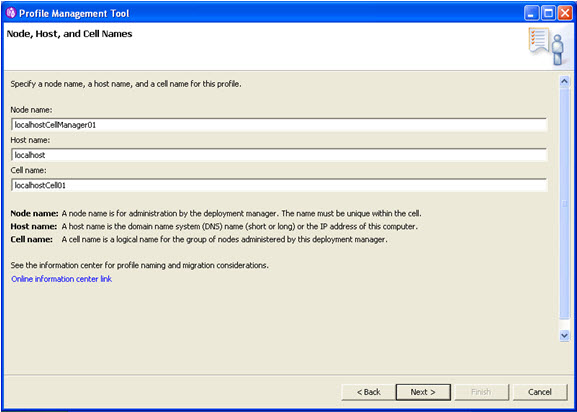
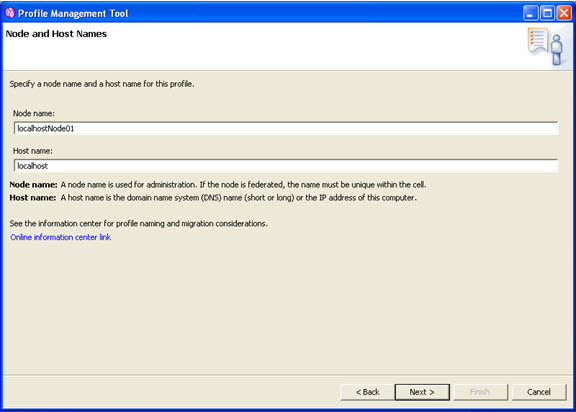
Specify the node name, host name and the cell name and click on next.

The above figure depicts the following:

  • Node name you can change if you want.
  • Host name is the local host as you are using only one machine
  • Cell name you can change if you want
    Node name and cell name can be changed, but host name is the name of the system.

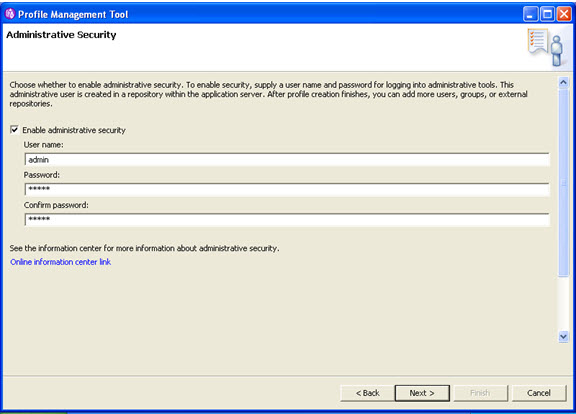
    Username: admin

    Password: admin

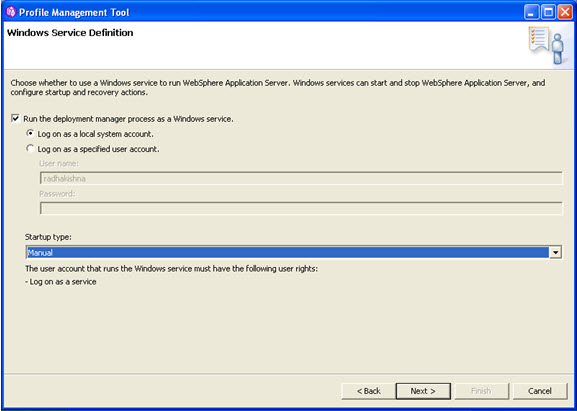
    Select start up type as manual.

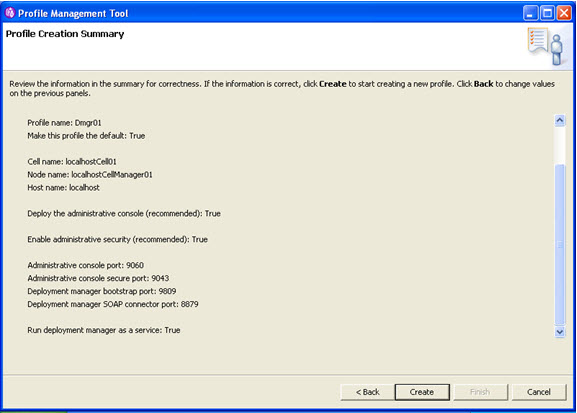
    Click on create, the profile Dmgr01 is being created.

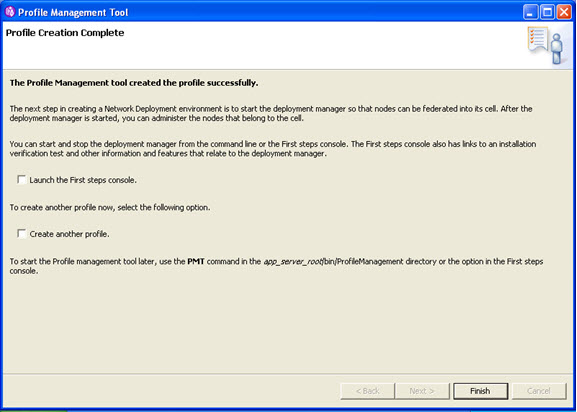
    Now only we are not launching the first step console.

    Click on finish.

    Now the deployment manager profile is created.

    To check the installation verification test manually.

    D:\Program Files\IBM\WebSphere\AppServer\profiles\Dmgr01\bin>ivt dmgr Dmgr01

    Now the profile Dmgr01 is created.

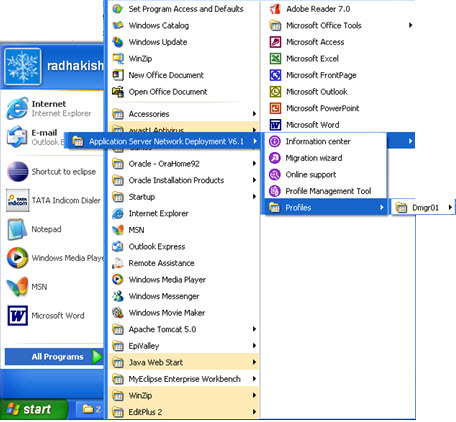
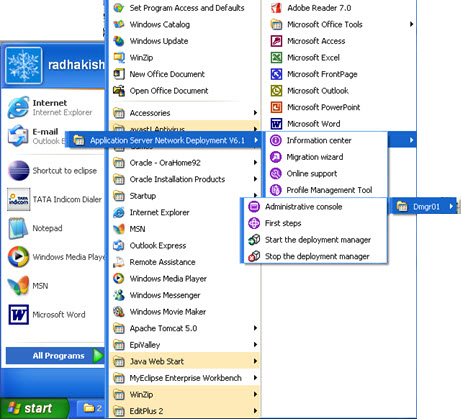
    See the options of the Dmgr01 profile.


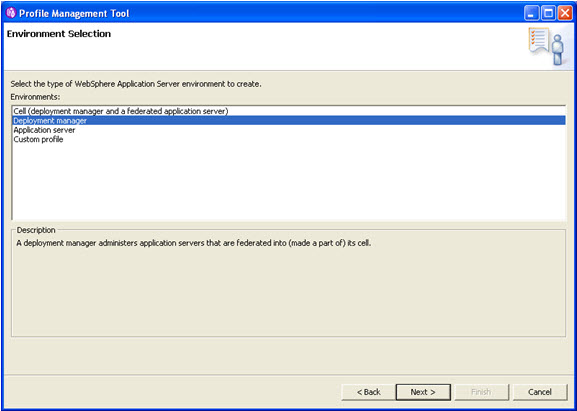
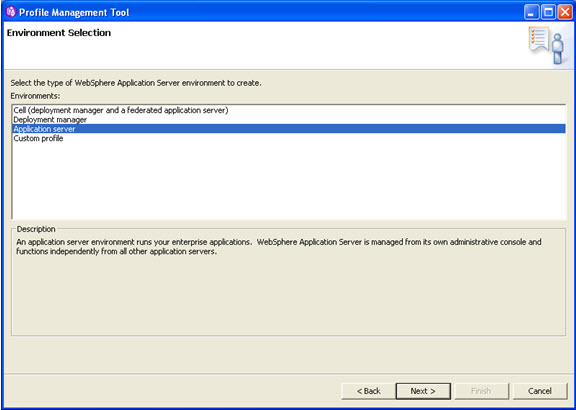
    3. Now we are going to create the Application Server Profile. Click on the profile Management tool.Select Application Server.

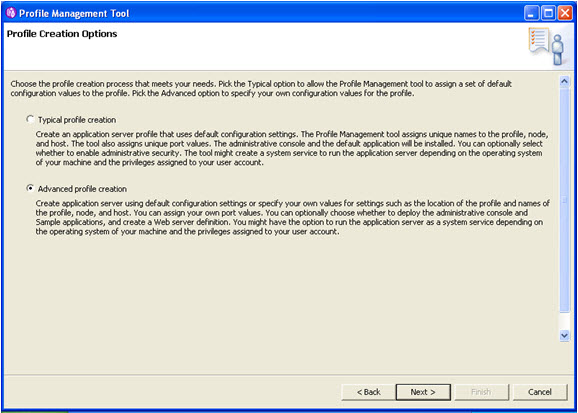
    Select advance profile creation and click on next.

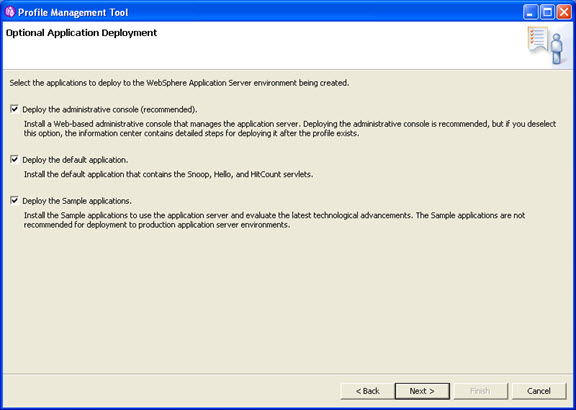
    Select the three checkboxes and click on next.

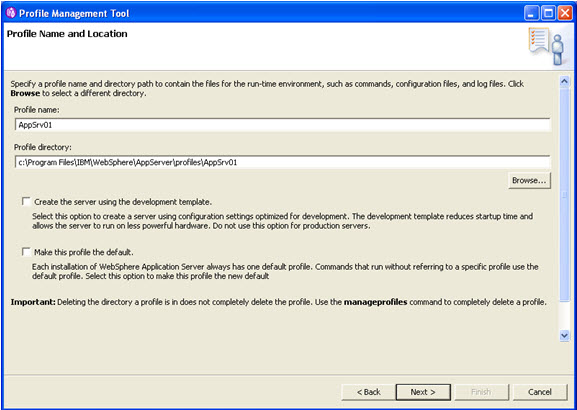
    Specify the profile name and directory and click on next.

    Specify the node name and the host name and click on next.

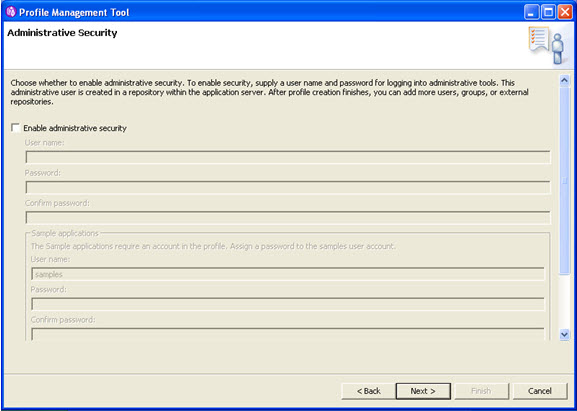
    We are not using security as of now.

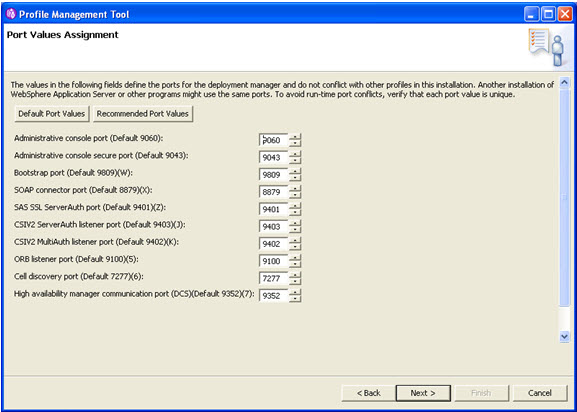
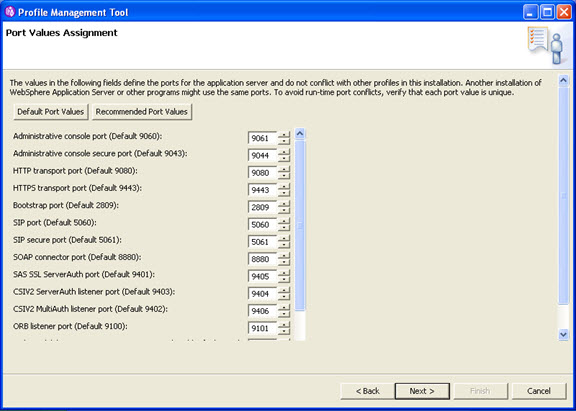
    Specify the ports and click on next.

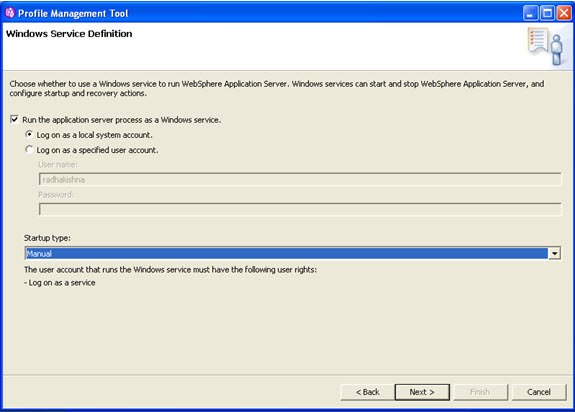
    Select “Run the application server process as a Windows service” and click on the next button.

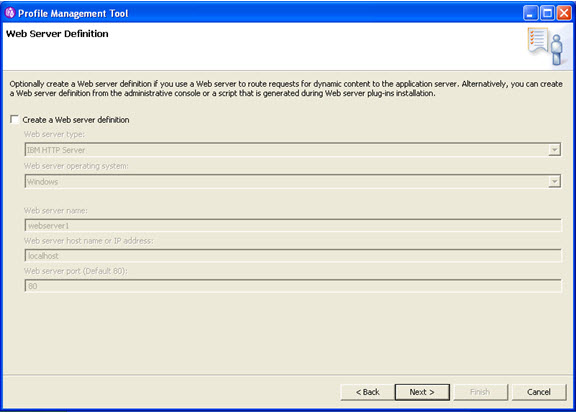
    Do not create a web definition. Click on next.

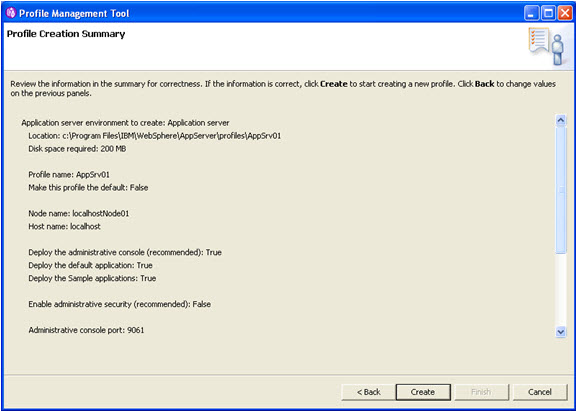
    Click on create.

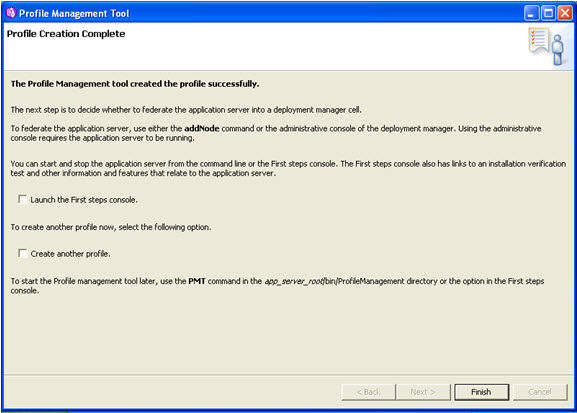
    We are not launching the first step console now.

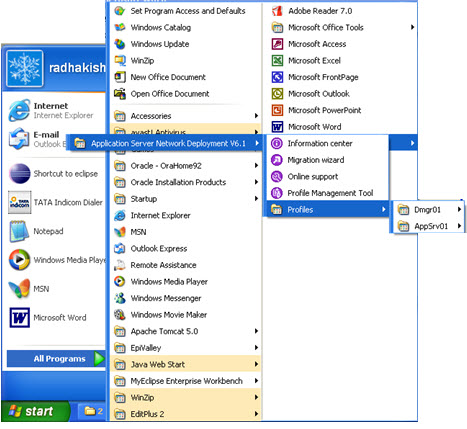
    Now in the profiles you can check application server profile is also created.

    For the installation verification test at the command prompt
    D:\Program Files\IBM\WebSphere\AppServer\profiles\AppSrv01\bin>ivt server1 AppSrv01

    ivt server1 AppSrv01 -> server1 is the name of the server , and AppSrv01 is the name of the profile.

    The name of the server is present in this location:
    D:\Program Files\IBM\WebSphere\AppServer\profiles\AppSrv01\config\cells\localhostNode01Cell\nodes\localhostNode01\servers


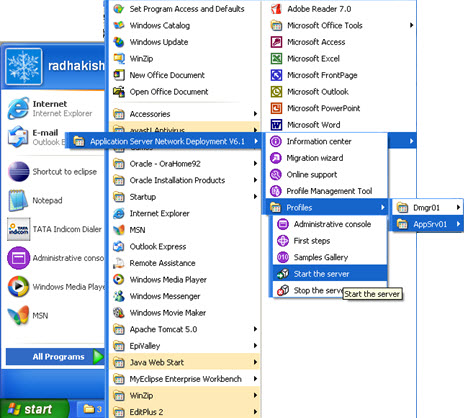
    NowFirst start the deployment manager and then the admin console of Deployment Manager Profile.

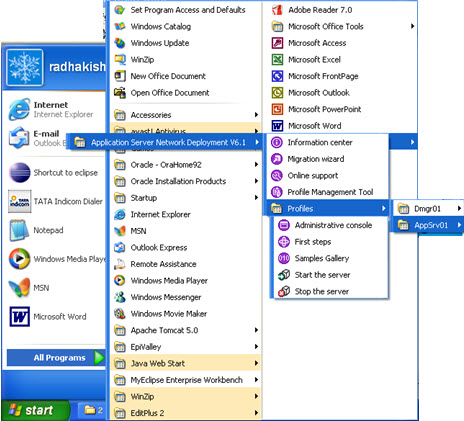
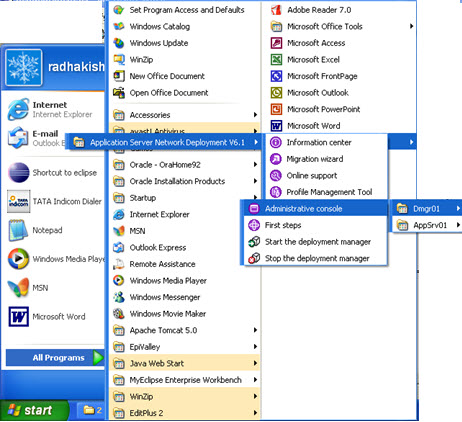
    Go to program files -> Ibm websphere

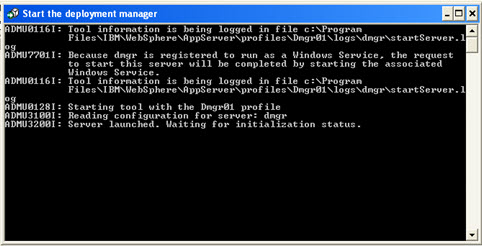
    Now first start the deployment manager, then start the Administrative console.

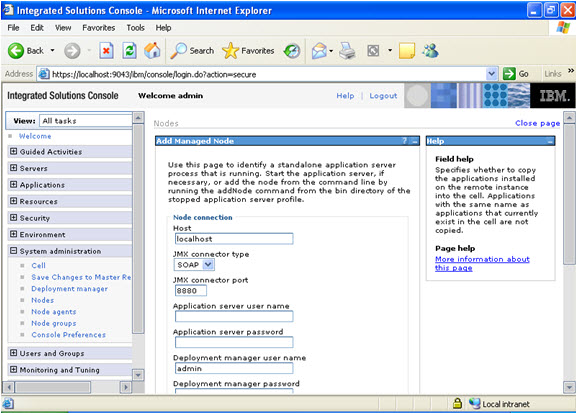
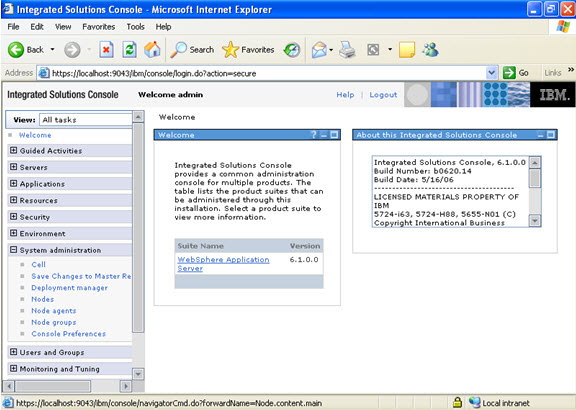
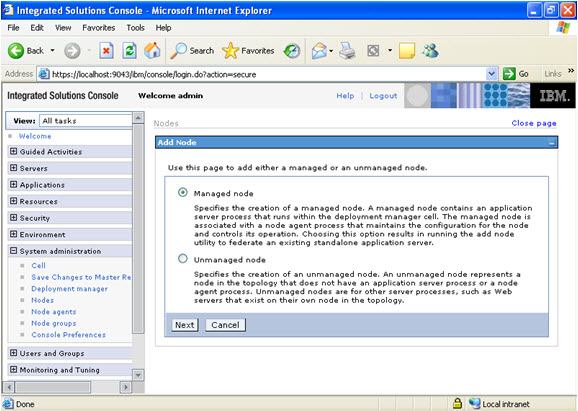
    Click on System administration, node, add node.

    Select managed node.

    Remember now you are in the Deployment manager profile Administrative console.

    Now to add the node, you go to the profiles.

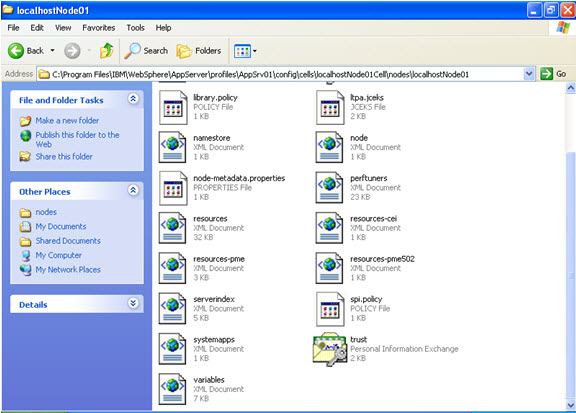
    Serverindex.xml file. Is present in the following location

    In the serverindex.xml file check for the SOAP_CONNECTOR ADDRESS ,

    Note: The port no in this case is 8880 and the ORB_LISTENER_ADDRESS, in this case is 9101

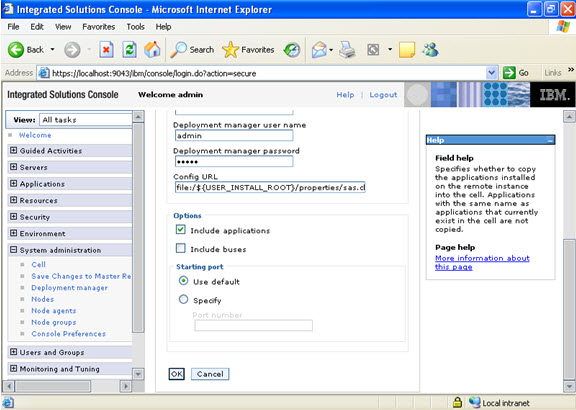
    Submit the following details as follows in the add node screen.

    Note: If the jmx connector type in the following figure is not SOAP AND you have selected RMI/IIOP then you have to use the ORB_LISTENER_ADDRESS port no.

    Note: now start the server and click on ok.

    After the server is started, then click on ok.

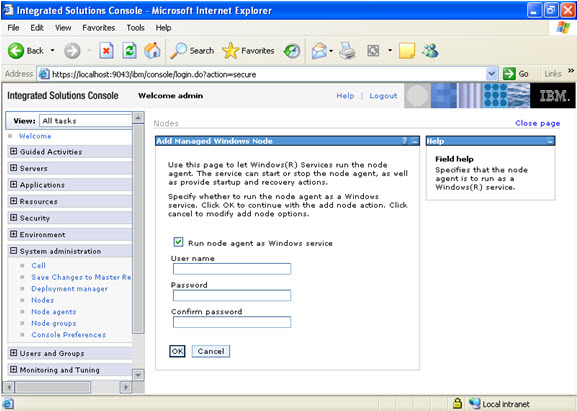
    Check on run node as windows service.

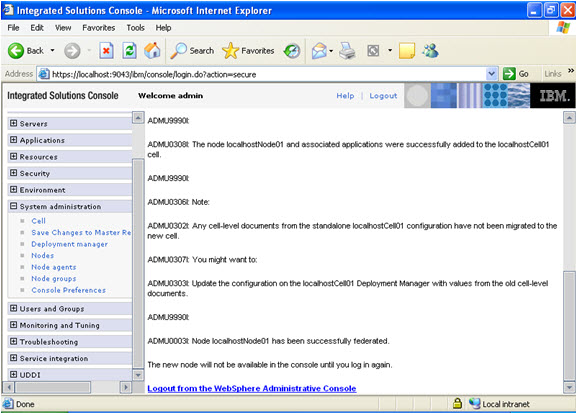
    Now the node is successfully added. You should log out and just login in again to see the new node

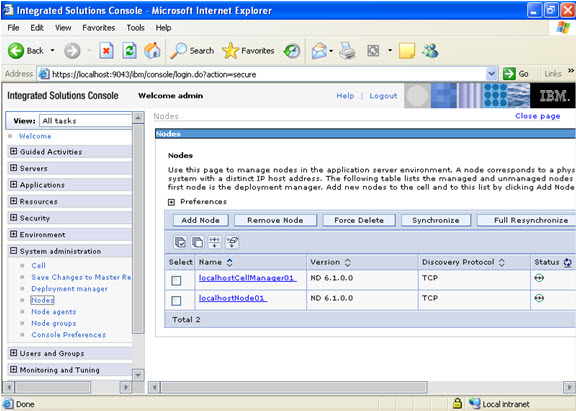
    The new node added is shown.


    To addNode from using the command prompt:Go to the command prompt,Application server/profiles/appsrv02/bin >addNode localhost 8879

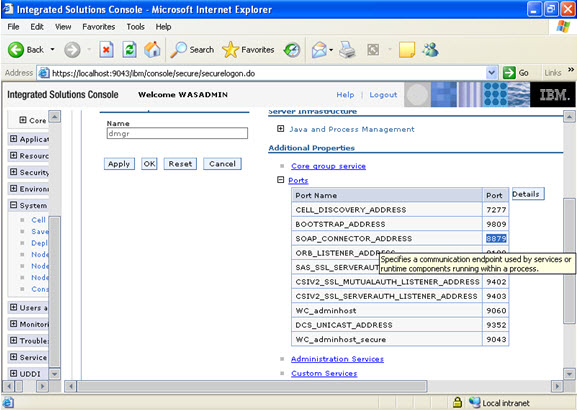
    8879 is the SOAP PORT ADDRESS OF THE DEPLOYMENT MANAGER.

    To include applications use –includeapps

    Note: also note that in the bin directory of the Deployment Manager, there is no utility addNode.

Websphere ND Install: Install IBM HTTP Server

Posted by Sagar Patil

Go to application server profile and start the server. Start the deployment manager. Go to the administrative console and login.

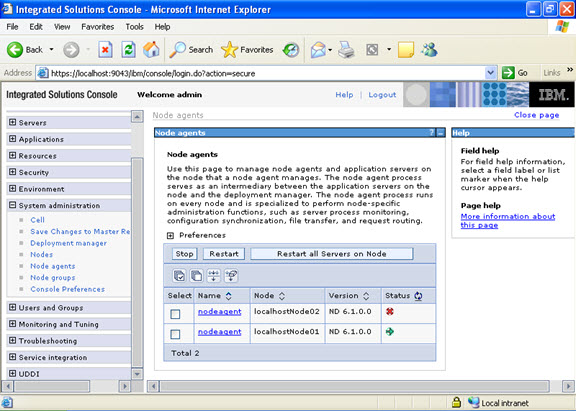
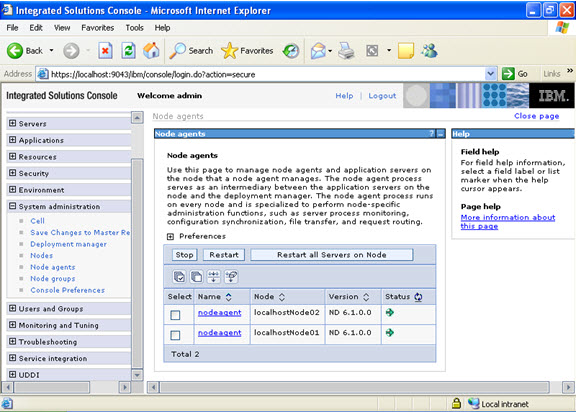
Now go to the node agents, if the node agents are not started up. It is necessary to start up the node agents.

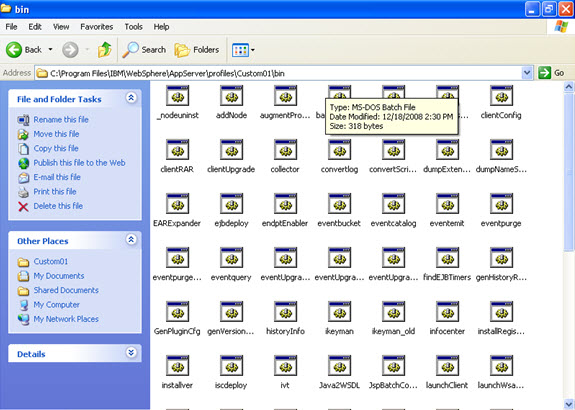
Manually go to the location of the node agents and use the startNode command.

This is the location:

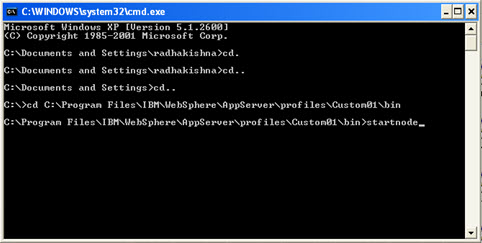
Execute at the command prompt as follows:

The node agent has been started up.

The same procedure is also to be followed to start the node agent of the Appserver.

C:\Program Files\IBM\WebSphere\AppServer\profiles\AppSrv01\bin\startnode

Here AppSrv01 is the server that we are using.

Now verify that the two nodes are started.


To install the webserver

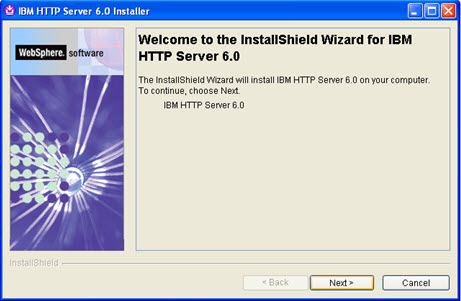
Go to 6.0 base/HIS/INSTALL.

Click on next.

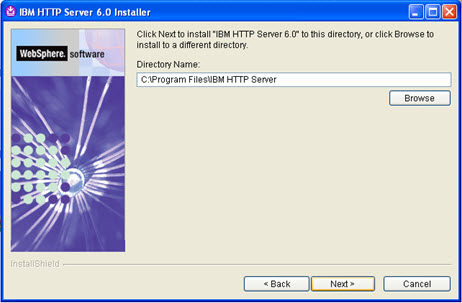
Select the directory where you want to install IBM HTTP Server 6.0 and click on the next button.

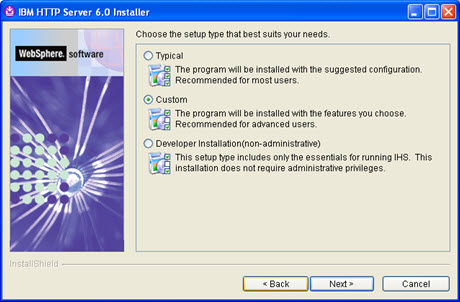
Select “Custom” and click on the next button.

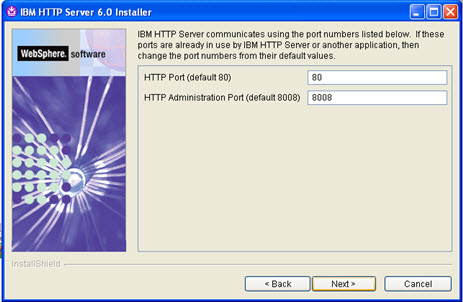
Specify the HTTP port and the HTTP Administration Port and click on next.

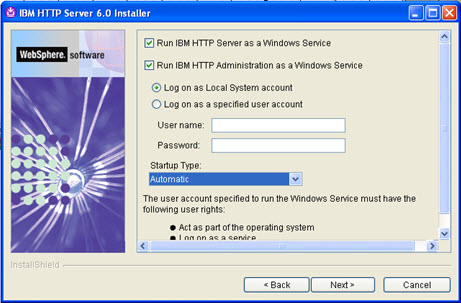
Select the two checkboxes and click on next.

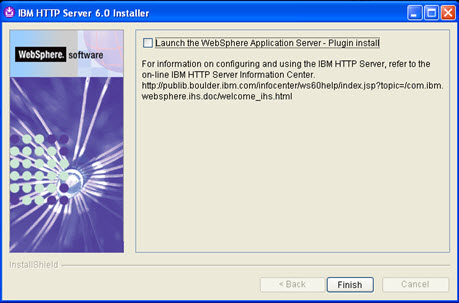
Uncheck the checkbox and click on finish.

Now the web server is installed.

Check in the program files.

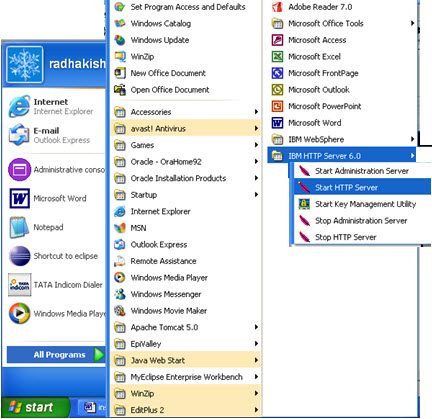
Start the web server.

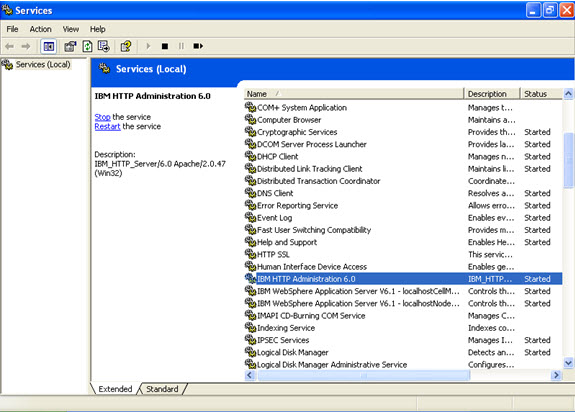
Go to services and start the IBM HTTP SERVICE.

Also in the browser check.

http://localhost

The web server console will open.


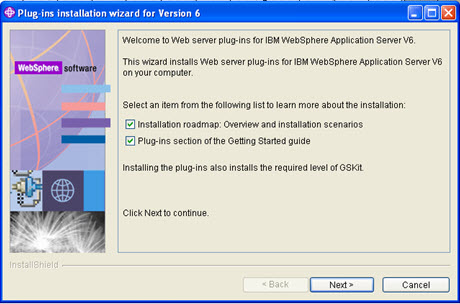
To install the plug-in software

Go to 6.0 base folder/ plugin/install

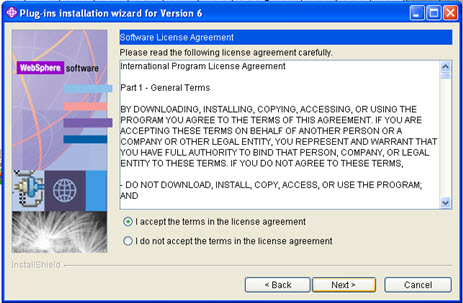
Accept the agreement and click on next.

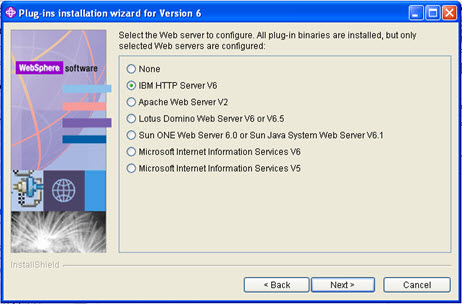
Select IBM HTTP Server V6 and click on next.

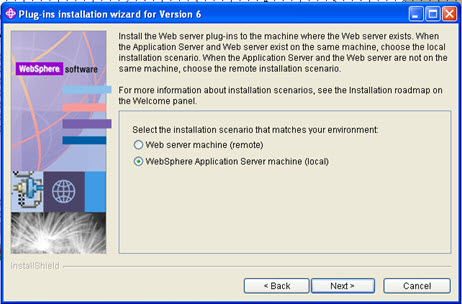
Select “Websphere Application Server machine (local)” and click on next.

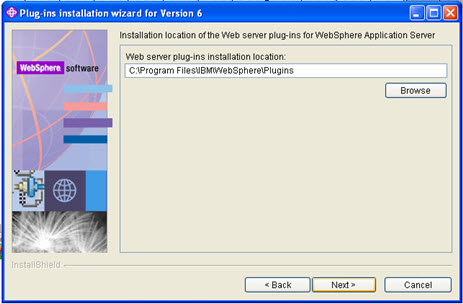
Specify the plug-ins installation directory and click next.

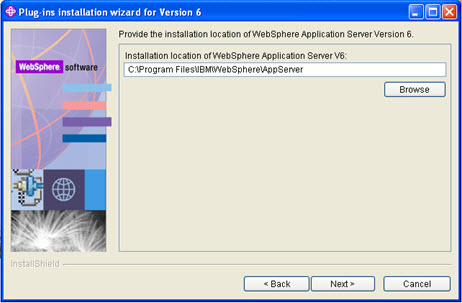
Select the location where you want the Websphere Application Server V6 to be installed and click on next after wards.

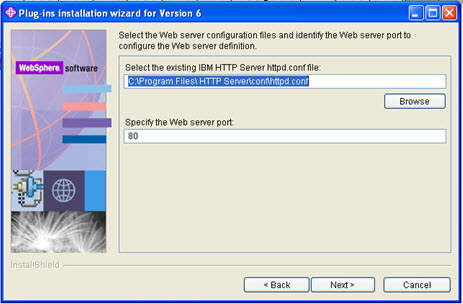
Select the httpconf file.


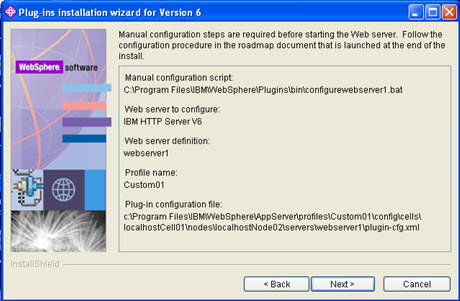
web-server plugin-cfg.xml file

C:\Program Files\IBM\WebSphere\AppServer\profiles\Custom01\config\cells\localhostCell01\nodes\localhostNode02\servers\webserver1\plugin-cfg.xml


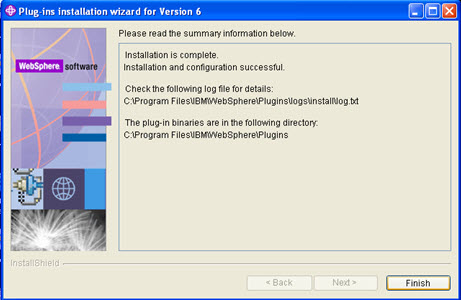
Click on Finish


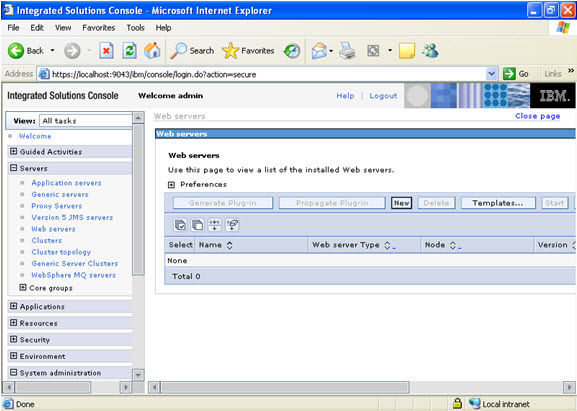
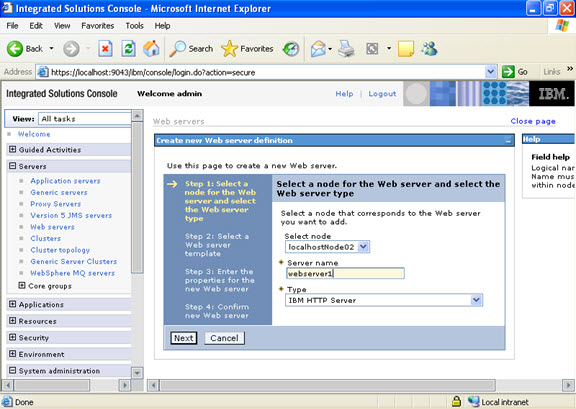
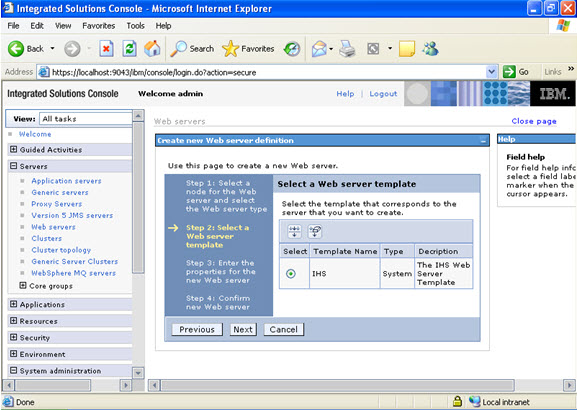
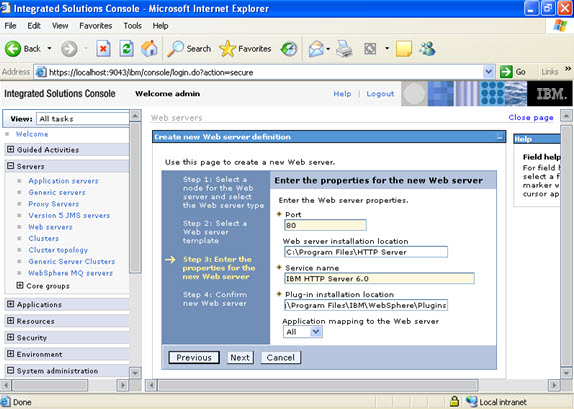
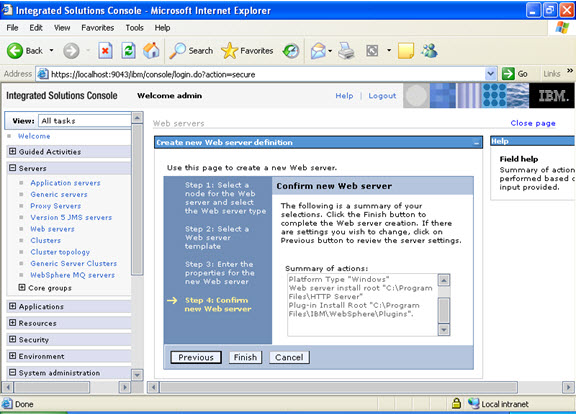
Now go to the web servers and create a new web server.

Fill the following details very carefully.

Check whether the application server and web server both are started.

After both web and application server are started, go to the enterprise applications and check the applications are started And then type

http://localhost/snoop in the browser and see the snoop servlet.

Websphere Diagnostics: Create & Analyze Trace Files

Posted by Sagar Patil

Read this as well

Navigate to DMGR -> Troubleshooting -> Logs and Trace ->

To enter a trace string to set the trace specification to the desired state:

  1. Click Troubleshooting > Logging and Tracing in the console navigation tree.
  2. Select a server name.
  3. Click Change Log Level Details.
  4. If All Components has been enabled, you might want to turn it off, and then enable specific components.
  5. Select Apply, then OK.

To know the exact location click on Runtime Tab and see the directory hosting trace.log file

I can see a trace.log at my directory now

Websphere: Using PerformanceMonitor Servlet to Monitor Performance Metric

Posted by Sagar Patil

The PerfServlet provides the performance data output as an XML document, The servlet provides a way to use an HTTP request to query the performance metrics for an entire WebSphere Application Server administrative domain.

First we need to deploy this servlet on (clustered) nodes  to be monitored before using it. The deployment is no way different than installing any EAR application file.

You can download and install PerfApp servlet from following links else visit IBM support portal
http://www.oracledbasupport.co.uk/wp-content/uploads/2010/09/perfServletApp.ear
http://www.oracledbasupport.co.uk/wp-content/uploads/2010/09/perfServletApp.war

http://%Server_name%:9080/wasPerfTool/servlet/perfservlet?module=beanModule+jvmRuntimeModule

Above URL will produce XML output file as  :http://www.oracledbasupport.co.uk/wp-content/uploads/2010/07/-1.xml

Locate perfServletApp.ear which is generally at installedApps directory under Profiles, goto deployment manager and install this ear file.

Access the performance matrix using URLs  below

Usage:

http://perfServlet_Host:port/wasPerfTool/servlet/perfservlet[?node=<node>&server=<server>&module=<module>]

The module name for which stats are displayed. Modules include the following:

  • alarmManagerModule
  • beanModule
  • cacheModule
  • connectionPoolModule
  • jvmRuntimeModule
  • j2cModule
  • objectPoolModule
  • orbPerfModule
  • schedulerModule
  • servletSessionsModule
  • systemModule
  • threadPoolModule
  • transactionModule
  • webAppModule
  • webServicesModule
  • wlmModule
  • wsgwModule

Node

The servlet can limit the information it provides to a specific host by using the node parameter.
http://Server1:9080/wasPerfTool/servlet/perfservlet?node=Server1_Node01

Server

The servlet can limit the information it provides to a specific server by using the server parameter.

For example, in order to limit the data collection to the server on all nodes, invoke the following URL:
http://Server1:9080/wasPerfTool/servlet/perfservlet?server=server_member1

To limit the data collection to the server invoke the following URL:
http://Server1:9080/wasPerfTool/servlet/perfservlet?node=Server1_Node01&server=server_member1

Module

The servlet can limit the information it provides to a specific PMI module by using the module parameter.
You can request multiple modules by using the following URL:
http://Server1:9080/wasPerfTool/servlet/perfservlet?module=beanModule+jvmRuntimeModule

For example, to limit the data collection to the beanModule on all servers and nodes, invoke the following URL:
http://Server1:9080/wasPerfTool/servlet/perfservlet?module=beanModule

To limit the data collection to the beanModule on the server ‘testserver’ on the node rjones, invoke the following URL:
http://Server1:9080/wasPerfTool/servlet/perfservlet?node=rjones&server=testserver&module=beanModule

To find the list of the modules, invoke the PerfServlet help with the following URL:
http://Server1:9080/wasPerfTool/servlet/perfservlet?action=help

http://Server1:9080/wasPerfTool/servlet/perfservlet?node=Server01_Node01&server=server_member1&module=jvmRuntimeModule


Monitoring Application Performance using Websphere Request Metrics

Posted by Sagar Patil

Version 6.x of WebSphere introduced Request Metrics (PMRM), which unlike Performance Monitoring Infrastructure (PMI) metrics, are transaction based.

PMRM can be a useful first step in performance analysis of your application. The PMRM records show the elapsed time for each request.
The PMRM records are written to the SystemOut log file for the JVM in which the request is processed. In a Network Deployment configuration, the WebSphere Http Plugin running inside the web server also writes PMRM records to its http-plugin.log file giving a composite view of application performance across all JVM’s.

The log records contains information about the flow of the transaction through the WebSphere JVMs. The last fields are of particular interest during performance monitoring.

The SystemOut file contains

1. Name of servlet

2. Response time

In addition, the web server http-plugin.log file contains

3. Size of the request

4. Size of the response

How to Activate Request Metrics ?

Select “Request Metrics” & you will a see screen below.

We can also set filters on modules to be logged

Let’s say we want to trace JDBC connections & transaction time.

Choose Custom -> JDBC & click “Standard logs” option to log information at SystemOut.log & http-plugin.log.

Once activated you will see details as below at Systemout.log

[16/08/11 15:23:58:529 BST] 000000e0 PmiRmArmWrapp I   PMRM0003I:  parent:ver=1,ip=172.30.9.24,time=1313495871159,pid=11183,reqid=16634,event=1 – current:ver=1,ip=172.30.9.24,time=1313495871159,pid=11183,reqid=16641,event=1 type=JDBC detail=java.sql.PreparedStatement.executeQuery() elapsed=0

[16/08/11 15:25:08:956 BST] 000000df PmiRmArmWrapp I   PMRM0003I:  parent:ver=1,ip=172.30.9.24,time=1313495871159,pid=11183,reqid=469,event=1 – current:ver=1,ip=172.30.9.24,time=1313495871159,pid=11183,reqid=522,event=1 type=JDBC detail=java.sql.PreparedStatement.executeQuery() elapsed=1

You should see similar records in http-plugin.log

How to Locate Connection Leak in Websphere

Posted by Sagar Patil

Websphere connection manager generally will timeout orphaned connections and send it back to connection pool for reuse. If threads do timeout waiting for connection, connection manager will raise Connectionwaittimeoutexception at websphere logs.

Common reason for connection leak is , application not using connection.close() call at finally{} code block. When trace is enabled, Websphere connection pool manager will print stack traces detailing how long connection been in use.

It only prints trace information if connection was in use for more than 10 seconds. This interval is unchangeable without IBM support assistance.

Let’s gather connection leak trace …
Navigate to Logging and Tracing > %Application_Server_Name%> Diagnostic Trace Service > Change Log Detail Level

Alter the logging level as *=info: ConnLeakLogic=finest

If you want to see all options availble click on “ConnLeakLogic” which will give you options like screenshot below, select finest.

You may have to restart Application server to see log being created $WAS_HOME/Profiles/node/logs/%Server_Name%/trace.log
Search Trace.log for keyword “Connection Leak Logic Information”. If present you know there are connections being used for more than 10 sec.

In an example above doGet method is using connection for 20 sec i.e 10 sec ping time +11 sec in use time.


Websphere Administrative Security ON/OFF

Posted by Sagar Patil

Instead of

Following setting will be changed at Security.xml :

Websphere : Node Synchronise problem

Posted by Sagar Patil

I had a strange problem this morning. The clustered JVMs were up but Nodeagent was failing to synchronise with DMGR leaving applications in partial start state.

My attempts to Sync NodeAgent from DMGR were unsuccessful
Dmgr > System administration -> Nodes Select NodeAgent and click on Synchronise else Full Synchronise.

How to Debug this error message?I decided to sync the nodeAgent manually

1. Stop all node-agents that seem broken (that would probably be all of them!).

2. Go to the node agents bin directory on the node (usually something like $WAS_HOME/profiles//bin/).
# Manually sync the node with syncNode.sh, point to the SOAP connector (default is 8879) on the DMGR server.
See example
./syncNode.sh dmgrhost 8879 -username websphere -password webfear
3. Start the node agent and verify that the logs are happy. Kick off a cell sync from dmgr.

Now this came back with some strange error.

I was looking at DMGR logs & Individual JVM logs for an error message but there were 1 line of message dumped at nodelogs (/opt/IBM/WebSphere/AppServer/profiles/Profile01/Node/logs/nodeagent//SystemOut.log ) as below  :

“Global security in the local process is Disabled. Global security in the sending process is Enabled”

What it meant was security at DMGR was enabled but somehow same settings were not there at nodeagent file “security.xml“

./dmgr/config/cells/server1_Cell/security.xml :
useLocalSecurityServer=”true” useDomainQualifiedUserNames=”false” enabled=”true” cacheTimeout=”600″ issuePermissionWarning=”false” activeProtocol=”BOTH” enforceJava2Security=”false” enforceFineGrainedJCASecurity=”false” appEnabled=”false” dynamicallyUpdateSSLConfig=”true” activeAuthMechanism=”LTPA_1″ activeUserRegistry=”WIMUserRegistry_1″ defaultSSLSettings=”SSLConfig_1″>

./Node/config/cells/server1_Cell/security.xml
useLocalSecurityServer=”true” useDomainQualifiedUserNames=”false” enabled=”false” cacheTimeout=”600″ issuePermissionWarning=”true” activeProtocol=”BOTH” enforceJava2Security=”false” enforceFineGrainedJCASecurity=”false” appEnabled=”false” dynamicallyUpdateSSLConfig=”true” activeAuthMechanism=”LTPA_1″ activeUserRegistry=”WIMUserRegistry_1″ defaultSSLSettings=”SSLConfig_1″>

I changed above settings at Node to true and bounced nodeagent and dmgr. The Nodes are now getting sync.

/opt/IBM/WebSphere/AppServer/profiles/Profile01/Node/logs/nodeagent/systemout.log now does say

0000003f NodeSyncTask  A   ADMS0003I: The configuration synchronization completed successfully.

Where to download Websphere Fix Pack

Posted by Sagar Patil

Navigate to http://www-01.ibm.com/support/docview.wss?rs=180&uid=swg24026350

You can click on relevant platform to download packages

For example if you click on Linux it will show following available packages :

If you are unsure, select “Maintenance Download Wizard

Websphere Diagnostic & Tuning Tools : IBM Support Assistant Workbench

Posted by Sagar Patil

Click on relevant Tools to see working example

Read more…

Websphere HTTP plugin failover in a clustered environment

Posted by Sagar Patil

We have a Websphere 6.1 vertical cluster i.e 2 JVMs in a single physical machine with IBM HTTP server.

Problem : Users complained  Http server is not properly failing connections when one of the JVM is hung/not responding

Background : In clustered IBM WebSphere Application Server environments, the HTTP plug-in has the ability to provide failover in the event the HTTP plug-in is no longer able to send requests to a particular cluster member. By default, there are several conditions under which the HTTP plug-in will mark a particular cluster member down and failover client requests to another cluster member that is still able to receive connections. They are listed as follows:

  • The HTTP plug-in is unable to establish a connection to a cluster member’s Application Server transport.
  • The HTTP plug-in detects a newly connected socket that was prematurely closed by a cluster member during an active read or write.

There are several configurable settings in the plugin-cfg.xml that can be tuned to affect how quickly the HTTP plug-in will mark a cluster member down and failover to another cluster member.

Sample $HTTP_HOME/Plugins/config/Plugin-cfg.xml file

<ServerCluster CloneSeparatorChange=”false” GetDWLMTable=”false” IgnoreAffinityRequests=”true” LoadBalance=”Round Robin” Name=”server1_cluster” PostBufferSize=”64″ PostSizeLimit=”-1″ RemoveSpecialHeaders=”true” RetryInterval=”60″>
<Server CloneID=”14l574lkv” ConnectTimeout=”0″ ExtendedHandshake=”false” LoadBalanceWeight=”2″ MaxConnections=”-1″ Name=”Server1_Node01_ihs_member1″ ServerIOTimeout=”0″ WaitForContinue=”false”>
<Transport Hostname=”Server1″ Port=”9080″ Protocol=”http”/>
<Transport Hostname=”Server1″ Port=”9443″ Protocol=”https”>
<Property Name=”keyring” Value=”/opt/IBM/WebSphere/Plugins/config/ihs/plugin-key.kdb”/>
</Transport>
</Server>
<Server CloneID=”14l574mci” ConnectTimeout=”0″ ExtendedHandshake=”false” LoadBalanceWeight=”2″ MaxConnections=”-1″ Name=”Server1_Node01_ihs_member2″ ServerIOTimeout=”0″ WaitForContinue=”false”>
<Transport Hostname=”Server1″ Port=”9081″ Protocol=”http”/>
<Transport Hostname=”Server1″ Port=”9444″ Protocol=”https”>
<Property Name=”keyring” Value=”/opt/IBM/WebSphere/Plugins/config/ihs/plugin-key.kdb”/>
</Transport>
</Server>
<PrimaryServers>
<Server Name=”Server1_Node01_ihs_member1″/>
<Server Name=”Server1_Node01_ihs_member2″/>
</PrimaryServers>
</ServerCluster>

ConnectTimeout Setting:
It is possible to add an attribute to the Server element called ConnectTimeout, which makes the plug-in use a non-blocking connect. Setting ConnectTimeout to a value of 0 is equal to not specifying the ConnectTimeout attribute, that is, the plug-in performs a blocking connect and waits until the operating system times out. Set this attribute to an integer value greater than zero to determine how long the plug-in should wait for a response when attempting to connect to a server. A setting of 10 will mean that the plug-in waits for ten seconds to time out.

Without ConnectTimeout http server will have to wait for OS timeout interval which will run into several minutes. This setting is very similar to ORACLE RAC VIP settings where oracle uses VIPs to detect timeouts/failover quickly over using OS or network interval.

ServerIOTimeout:
The ServerIOTimeout attribute of a server element enables the HTTP plug-in to set a time out value, in seconds, for sending requests to and reading responses from a cluster member. If a value is not set for the ServerIOTimeout attribute, the HTTP plug-in, by default, uses blocked I/O to write request to and read responses from the cluster member until the TCP connection times out.

RetryInterval:
An integer specifying the length of time that should elapse from the time that a server is marked down to the time that the HTTP plug-in will retry a connection. The default is 60 seconds.

As you can see , both settings ConnectTimeout & ServerIOTimeout are not set in this environment. For additional details visit http://www-01.ibm.com/support/docview.wss?uid=swg21219808

How to Analyze JVM logs (SystemOut.log, SystemErr.log & startServer.log)

Posted by Sagar Patil

Websphere writes formatted text log messages to SystemOut.log,SystemErr.log & startServer.log files.

Sample SystemOut.log

[14/08/11 07:06:54:204 BST] 0000000a ManagerAdmin  I   TRAS0017I: The startup trace state is *=info.
[14/08/11 07:06:54:683 BST] 0000000a ManagerAdmin  I   TRAS0111I: The message IDs that are in use are deprecated

[14/08/11 07:06:55:606 BST] 0000000a FileRepositor A   ADMR0010I: Document cells/server1_Cell/nodes/server1_Manager/node-metadata.properties is modified.

[14/08/11 07:06:57:823 BST] 0000000a ThreadPoolMgr W   WSVR0626W: The ThreadPool setting on the ObjectRequestBroker service is deprecated.

[21/05/10 10:02:56:240 BST] 00000012 TCPPort       E   TCPC0003E: TCP Channel TCP_5 initialization failed.  The socket bind failed for host * and port 9352.  The port may already be in use.
[21/05/10 10:02:56:244 BST] 00000012 TCPPort       E   TCPC0003E: TCP Channel TCP_5 initialization failed.  The socket bind failed for host * and port 9352.  The port may already be in use.

[15/08/11 03:49:59:333 BST] 0000003c SystemOut     O Debug options: file:/opt/IBM/WebSphere/AppServer/profiles/Profile01/dmgr/.options not found
[15/08/11 03:49:59:512 BST] 0000003c SystemOut     O Need to load org.eclipse.osgi.framework.internal.protocol.reference.Handler
[15/08/11 03:49:59:585 BST] 0000003c SystemOut     O Time to load bundles: 76

# Time Stamp: The first part of the log message in sample code is  [15/08/11 03:49:59:585 BST]. It is the time stamp when the message was written. The time stamp is formatted using the locale of the process and it is 24 hour time stamp with milli-second precision

# Thread ID : The next part in the log message is 00000012 /0000003c , which represents the thread id. The thread ID is an eight-character hexadecimal value that is generated from the hash code of the thread that issued the message

# Short name : The short name is the abbreviated name of the component that issued the message. This name is typically the class name of a WAS component and would be some other identifier for the application. here ThreadPoolMgr , FileRepositor , TCPPort etc

# Event Type: The event type is a one character field that indicates the type of the message. The possible values are
* F- Fatal message
* E- Error message
* W- Warning message
* A- Audit message
* I- Informational message
* C- Configuration message
* D- detail message
* O- Messages that are written directly to System.out by an application or server component
* R- Messages that are written directly to System.err by the user application or internal component.
* Z- Place holder to indicate type was not recognized

# Message identifier (TCPC0003E/WSVR0626W/ADMR0010I): The message identifier is a string that is nine characters in length and is in the form CCCC1234X. The first four characters indicate the WAS component that issues the message. The next four characters indicate the specific message that component is issuing. The last character indicates the severity of the message. Its value is either I- informational, W- Warning or E error.

# Message: The message is the data that is logged to the SystemOut.log by the component

Sample SystemErr.log

[21/05/10 10:06:22:772 BST] 0000002b SystemErr     R Warning: unable to load “pr3native” library (using path: /opt/IBM/WebSphere/AppServer/java/jre/bin:/opt/IBM/WebSphere/AppServer/bin::/usr/lib:/opt/IBM/WebSphere/AppServer/lib/WMQ/java/lib) Root cause: pr3native (Not found in java.library.path)
[21/05/10 10:07:43:844 BST] 00000036 SystemErr     R 21-May-2010 10:07:43 com.pega.pegarules.ra.priv
INFO: Attempting to connect to JMS queue for asynchronous task execution

Sample startServer.log

************* End Display Current Environment *************
[21/05/10 10:02:41:607 BST] 0000000a ManagerAdmin  I   TRAS0017I: The startup trace state is *=info.
[21/05/10 10:02:41:671 BST] 0000000a AdminTool     A   ADMU0128I: Starting tool with the dmgr profile
[21/05/10 10:02:41:673 BST] 0000000a AdminTool     A   ADMU3100I: Reading configuration for server: dmgr
[21/05/10 10:02:43:570 BST] 0000000a AdminTool     A   ADMU3200I: Server launched. Waiting for initialization status.
[21/05/10 10:03:04:866 BST] 0000000a AdminTool     A   ADMU3000I: Server dmgr open for e-business; process id is 902

Diagnosing IBM Websphere Service logs

Posted by Sagar Patil

The IBM service log
The IBM service log, referred to as the service log, is a binary file. It contains information written to System.out by the Application Server run time as well as special messages that contain extended service information. This extended service information has been useful to IBM WebSphere Service teams in solving complex problems. IBM has now created additional tools to decipher these binary service logs, such as the Log Analyzer in Application Server. However, it is best to solve as many problems as possible during the development phase, before deploying to a production Application Server environment.

The service logs (activity.log) are normally located at $WAS_HOME/Profiles/dmgr/logs & $WAS_HOME/Profile/Node/Logs

[was61@Profile01]$ pwd
/opt/IBM/WebSphere/AppServer/profiles/Profile01
[was61@Profile01]$ du -a | grep activity.log
724     ./dmgr/logs/activity.log
2052    ./Node/logs/activity.log

Using showlog to see contents of Service log (activity.log)
You can find the showlog tool inside the WebSphere/AppServer/bin folder. If you execute it without arguments it will print out help for that tool

[was61@Profile01]$ /opt/IBM/WebSphere/AppServer/bin/showlog ./dmgr/logs/activity.log | more
$LANG = en_GB
$CODESET = UTF-8
—————————————————————
ComponentId:     Application Server
ProcessId:       26053
ThreadId:        0000000a
ThreadName:      main
SourceId:        com.ibm.ws.management.AdminInitializer
ClassName:
MethodName:
Manufacturer:    IBM
Product:         WebSphere
Version:         Platform 6.1 [ND 6.1.0.31 cf311015.02]
ServerName:      Cell\_Manager\dmgr
TimeStamp:       2011-08-14 07:06:54.943000000
UnitOfWork:
Severity:        3
Category:        AUDIT
PrimaryMessage:  ADMN0015I: The administration service is initialized.
…………………..


Logging commands executed through Websphere(WAS) Admin Console

Posted by Sagar Patil

Use this feature if you want to log or capture “wsadmin” commands excuted by WAS internally. It can be very useful when you want to automate your tasks and don’t know exact wsadmin syntaxes to use.

A logging could be enabled by 2 ways:

View Administrative scripting command for last action:
* Every time you perform an action a “View Administrative scripting command for last action” link shows up on the right hand side, if you click on the link a dialog box will open with the wasadmin command that is executed to perform the action

I navigated to DMGR-> “Applications” ->  Enterprise Applications -> At right hand Side I can see “View administrative scripting command for last action”
A click at View administrative scripting command for last action shows:
Administrative Scripting Command
AdminApp.list()

Log command assistance commands:
* You can enable the option “Log command assistance commands” at DMGR -> System administration -> preference. Once you do that every time you perform action in WAS Admin command the equivalent command will get saved in the log file.

Enable command assistance notifications
Specifies whether to send Java Management Extensions (JMX) notifications that contain command assistance data from the administrative console. Enablement of the notifications allows integration with product tools such as the WebSphere Application Server Toolkit (AST) Jython editor. Enablement of this option is recommended for non-production environments only.
Default     false (cleared)

Log command assistance commands
Specifies whether to log all the command assistance wsadmin data to a file. This file is saved to ${LOG_ROOT}/server/commandAssistanceJythonCommands_user name.log , where:
* server is the server process where the console runs, such as dmgr or server1.
* user name is the administrative console user name.
Occasionally clean out the file to manage its growth.

After i turned the preference on, i went to WAS Admin console and stopped my JVM. Then i went to dmgr_profile_root/logs directory and i could see commandAssistanceJythonCommands_patilsa.log file like this.

[was61@dmgr]$ ls -lrt
-rw-r–r– 1 was61 was61     5 Aug 14 07:07 dmgr.pid
-rw-r–r– 1 was61 was61   138 Aug 15 03:51 commandAssistanceJythonCommands_patilsa.log
-rw-r–r– 1 was61 was61 38373 Aug 15 03:52 SystemOut.log

vi commandAssistanceJythonCommands_patilsa.log

# [15/08/11 03:56:33:300 BST] ApplicationDeployment
AdminApp.list()

# [15/08/11 03:57:22:059 BST] Server status feedback
AdminControl.invoke(‘WebSphere:name=server_member2,process=server_member2,platform=proxy,node=Server1_Node01,j2eeType=J2EEServer,version=6.1.0.31,type=Server,mbeanIdentifier=cells/Server1_Cell/nodes/Server1_Node01/servers/server_member2/server.xml#Server_1259674426040,cell=Server1_Cell,spec=1.0,processType=ManagedProcess’, ‘stop’)

# [15/08/11 03:59:50:263 BST] Application servers
AdminControl.invoke(‘WebSphere:name=NodeAgent,process=nodeagent,platform=common,node=Server1_Node01,diagnosticProvider=true,version=6.1.0.31,type=NodeAgent,mbeanIdentifier=NodeAgent,cell=Server1_Cell,spec=1.0’, ‘launchProcess’, ‘[server_member2]’, ‘[java.lang.String]’)

Top of Page

Top menu